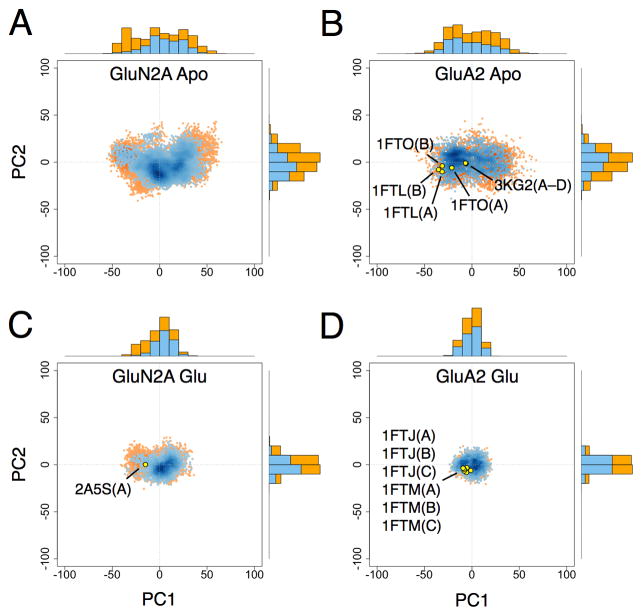
Figure 9. Principal component distributions for GluN2A and GluA2.
(A) 2D projection of apo GluN2A LBD conformers generated from umbrella sampling simulations onto the PC1–PC2 plane with W(ξ1, ξ2) < 1 and < 2 kcal mol−1 shown in blue and orange, respectively; 1D projections onto either PC1 or PC2 are represented by marginal histograms. (B) Projection of apo GluA2 conformers; the 2D projections of selected crystal structures are shown as yellow points. (C) Projection of GluN2A-glutamate conformers. (D) Projection of GluA2-glutamate conformers. See also Figure S4.

