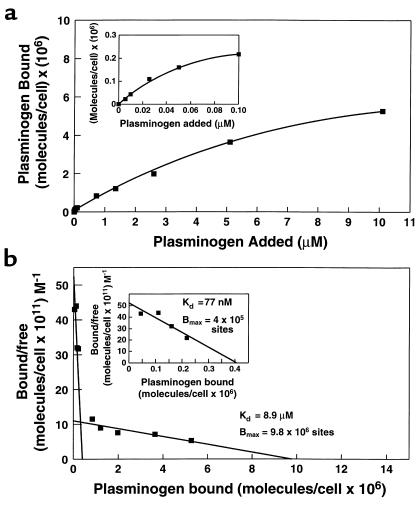
Figure 6.
Plasminogen binding to PC12 cells as a function of plasminogen concentration. (a) PC12 cells (107/ml) were incubated with increasing concentrations of 125I-plasminogen from 5 nM to 100 nM. To measure the lower-affinity binding site, 0.1 μM 125I-plasminogen was incubated with the cells in the presence of increasing concentrations of unlabeled plasminogen for 1 hour at 37°C. Nonspecific binding was defined as binding observed in the presence of 0.2 M EACA and was equivalent to 9.4% of total 125I-plasminogen binding. Specific binding was calculated by subtracting nonspecific binding from total binding. The inset shows the binding isotherm for the high-affinity binding site plotted on an expanded scale. (b) Scatchard analysis of the data obtained in the binding isotherm in a. The inset shows the Scatchard plot for the high-affinity binding site plotted on an expanded scale.

