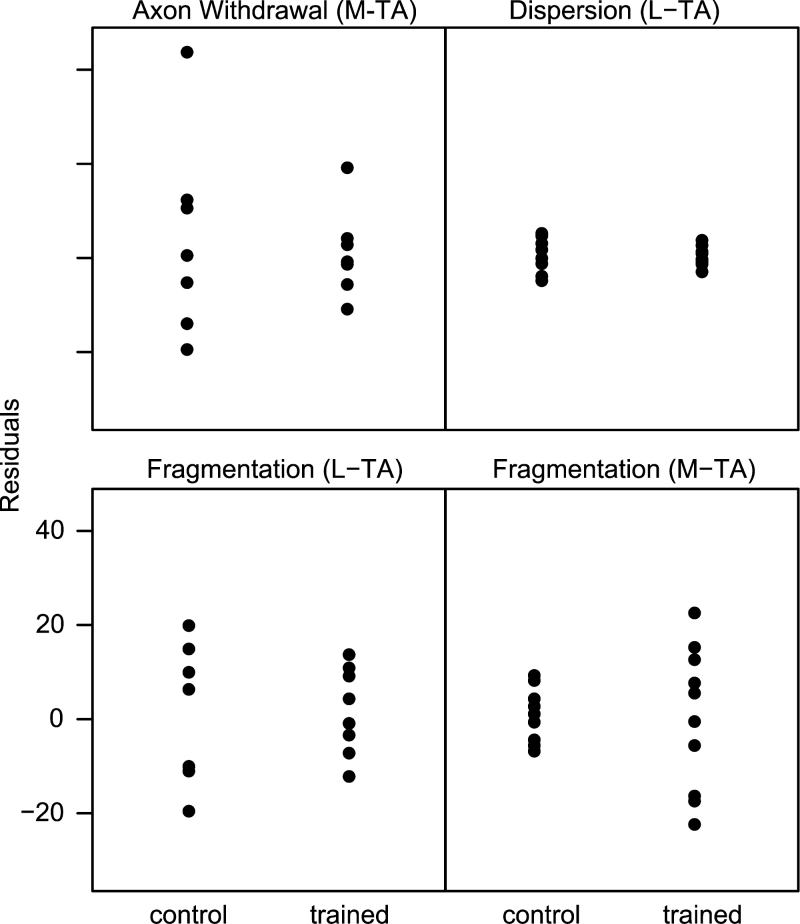
Figure 8.
Plot of residuals showing training significantly decreases variability in the old group (range of residuals in old trained is less than old control) in all plotted variables except fragmentation in the medial TA, which shows the opposite effect (L-TA = lateral TA; M-TA = medial TA). TA = thyroarytenoid.

