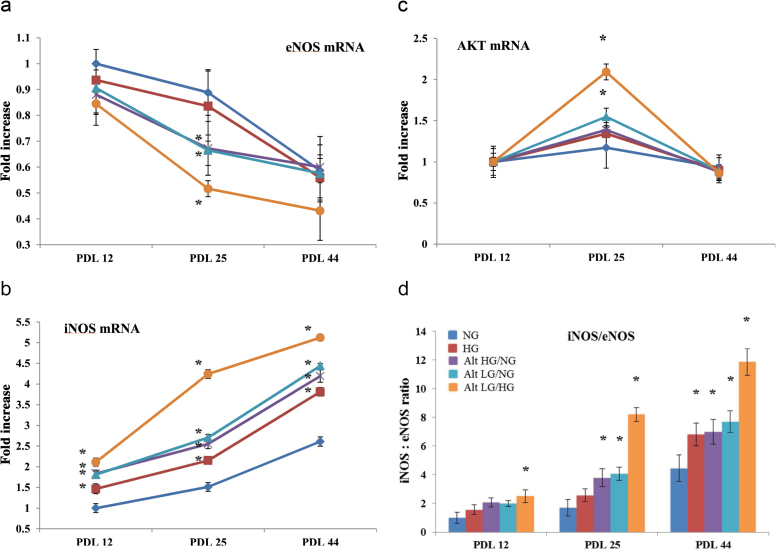
Figure 9.
Real-time quantitative reverse transcription PCR (qRT-PCR) quantification of gene expression in human umbilical vein endothelial cells (HUVECs) treated with high and/or low glucose. Determination by qRT-PCR of (a) eNOS mRNA (b) iNOS mRNA, and (c) AKT mRNA levels, in control (normal 5.5mM) and experimental HUVECs exposed to high (25mM) and/or low (1.5mM) glucose concentration at the designated population doubling time point. (d) The results represent the ratio generated by dividing the values of the above-mentioned amplified transcripts and constitutive GAPDH determined by optical density. *p < .05 of the experimental HUVECs in comparison with their respective control HUVECs. ◊ = NG, ■ = HG, X = Alt HG/NG, ▲ = Alt LG/NG, ● = Alt LG/HG.

