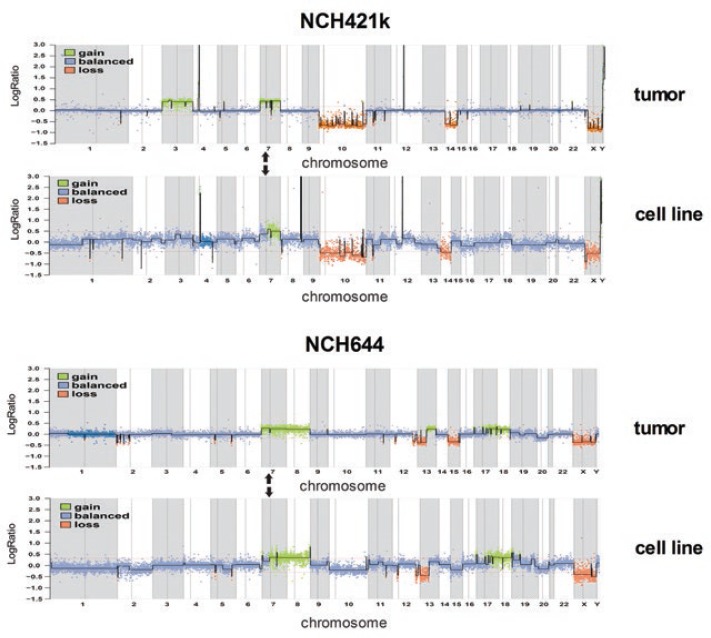
FIGURE 1.
Array CGH profile of NCH421k and NCH644 cells and corresponding biopsies. Array-CGH analysis of NCH421k11 and NCH644 primary tumors and the respective cell lines showing typical GBM aberrations that are preserved in the cell lines, and consistent absence of EGFR amplification. Panels on the right show NCH644 primary tumor (top) and cell line (bottom). The relative DNA copy number of genome fragments are plotted on the Y-axis in order of their chromosome mapping positions (X-axis). Arrows mark the mapping position of the EGFR locus on chromosome 7p.

