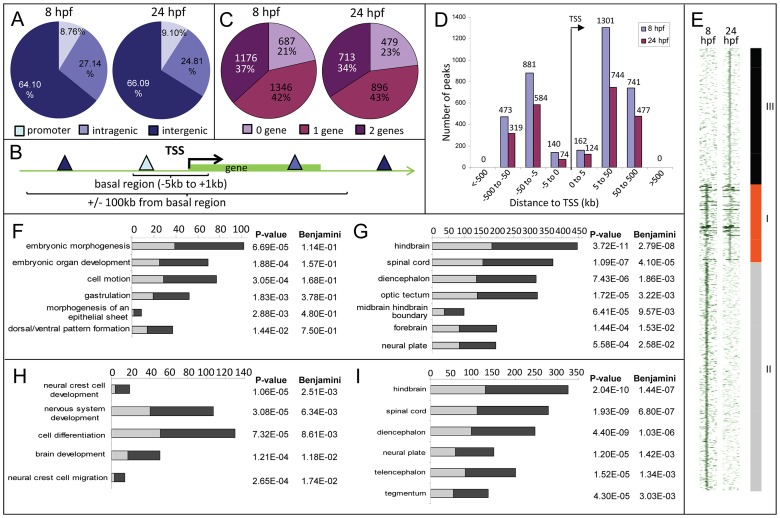
Figure 2. Distribution of Zic3 peaks as identified in ChIP-seq experiments according to GREAT algorithm.
A, distribution of peaks located in promoter (within 5 kb upstream of TSS), intragenic, and intergenic regions. B, gene association rule of ‘basal plus 100 kb’ according to GREAT algorithm. C, percentage of peaks associated with none, one, or two genes based on the gene association rule in B. D, number of peaks present in each distance categories along the x-axis, with regards to TSS of associated gene. E, region map showing overlap between genomic locations of peaks in 8 hpf and 24 hpf datasets. F–I, list of biological processes and tissue specific expression terms enriched among Zic3-associated genes at 8 hpf (F, G) and 24 hpf (H, I) according to DAVID GO terms. Light and dark grey bars represent the expected and observed enrichments of functional categories indicated along the y-axis.

