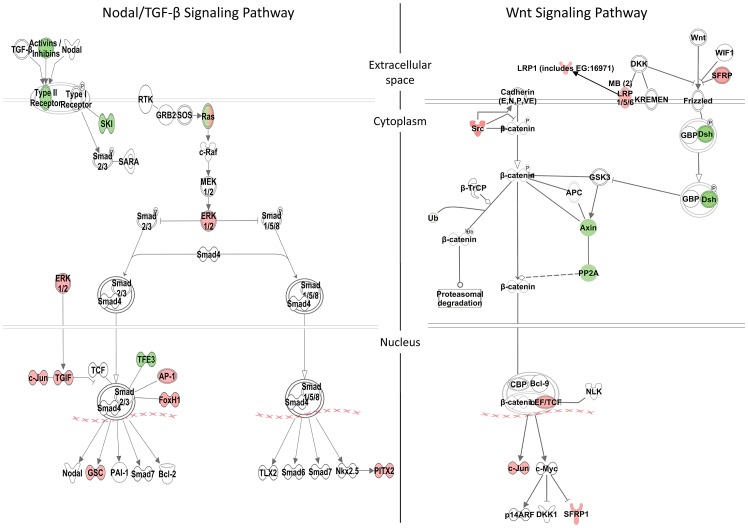
Figure 5. Zic3-regulated genes in the Nodal and Wnt signaling pathways.
Schematic diagram of the Nodal/TGF-β and Wnt signaling pathways generated by the Ingenuity Pathway Analysis Software. Genes differentially regulated by Zic3 are shown in colour – red for upregulation and green for downregulation of their expression patterns in the microarray data.

