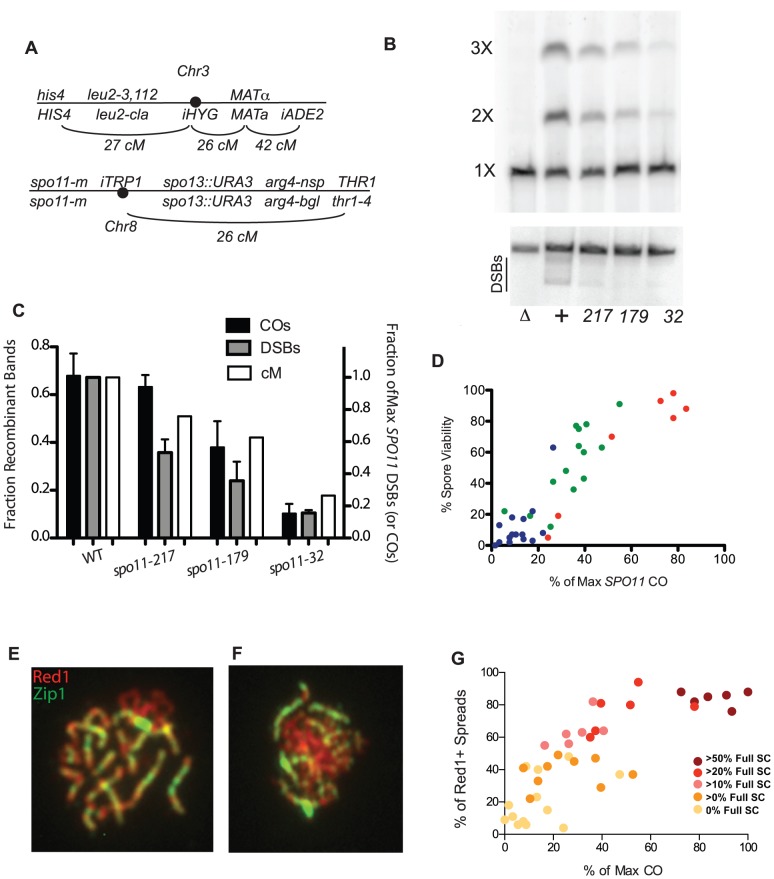
Figure 1. Crossing over, spore viability and chromosome synapsis in spo11 hypomorphs.
A, Marker configuration in diploids. spo11-m refers to homozygous SPO11 alleles. B, Physical analysis of crossing over between linear and circular versions of chromosome 3 and DSB formation on chromosome 3. Top panel: a spo11 null mutant (Δ),WT (+), and three spo11 hypomorphs (alleles 217, 179 and 32) were sporulated at 31.5°C for 48 hrs. Chromosomes were fractionated on a CHEF gel and examined by Southern blot analysis probing with chromosome 3 sequences. The positions of linear monomers (1×), dimers (2×) and trimers (3×) are indicated. Circular chromosomes do not enter the gel. Bottom panel: Same as top panel, but strains were sae2Δ. The smears under the linear chromosome 3 (indicated by the black line) represent the broken circular 3 (just under linear band) and broken linear chromosome 3. C, Quantitation of CO and DSB products. The fraction of Recombinant Bands (dark shaded bars) was calculated as the sum of dimer and twice the trimer band divided by the sum of all three bands. (SDs, black bars). %DSBs (intensity below linear band) were normalized to WT (grey bars) where wild-type cut chromosomes were 18% of the total. Also plotted are the corresponding genetic CO values for each strain (white bars) expressed as a percent of the maximum level of chromosome 3 COs observed (Table S1). D, Spore viability in spo11 mutants was measured in SPO13 strains by dissection of at least 20 tetrads (Table S2). The color reflects sporulation temperature (red = 31.5°C, green = 22°C and blue = 18°C). E, F. Examples of spread nuclei (Red1, red and Zip1, green). E: full SC; F: some SC. G. Red1 positive chromosome spreads were scored as “no SC”, “some SC” or “full SC” (Table S2). The percentage of SC containing nuclei, is plotted against CO level, with data points colored to indicate the percentage of SC-containing nuclei showing full synapsis.

