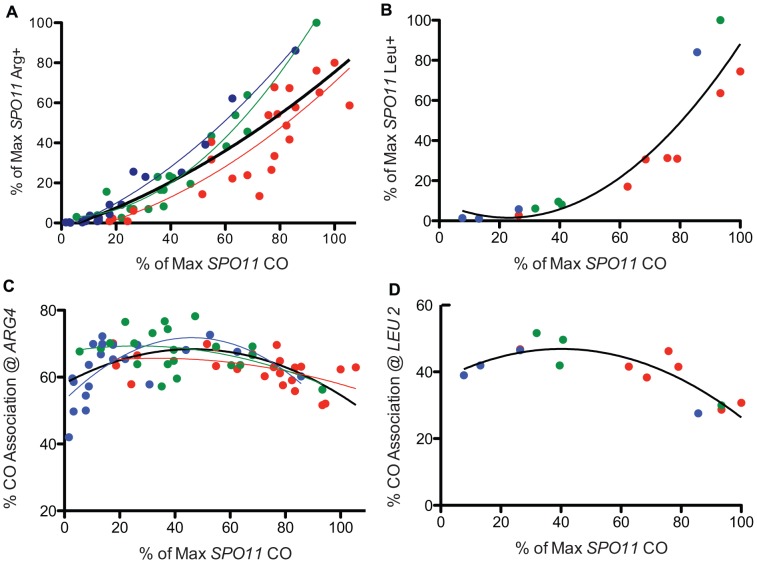
Figure 3. Prototroph formation and CO association in spo11 hypomorphs.
A. WT and spo11 mutants were sporulated at three temperatures (18°C, 22°C and 31.5°C) and plated to select Arg+. Prototroph frequencies, expressed as a percent of the maximum value observed among all strains tested at all temperatures (Table S1), are plotted against overall CO frequencies on chromosome 3, expressed as a percent of the maximum level of SPO11 COs (Table S1). The color of the data points and the associated least squares fitted lines reflects the temperature in which the diploid was sporulated (red = 31.5°C, green = 22°C and blue = 18°C and the black line encompasses data from all temperatures). B. Prototrophs were measured at LEU2 for three spo11 mutants (alleles 217, 179 and 32) and WT at three temperatures. Additional points (31.5°C) represent three Spo11 “reduced” mutants (see Table S3, S6). Raw data were normalized as described above and then plotted. The solid black line shows the least squares fit for the complete dataset. C. WT and spo11 mutants were sporulated at 18°C, 22°C and 31.5°C (blue, green and red data points, respectively) and assayed for flanking marker exchange among Arg prototrophs (Table S1). The colored lines reflect the least squares fit for each temperature and the solid black line represents a least squares fit to the complete dataset. The % CO association @ ARG4 is the percent of Arg prototrophs with a CO in the TRP1-THR1 interval. D. Three mutants (alleles 217, 179 and 32) and three Spo11 “reduced” mutants (see Table S3, S6) and WT were assayed for CO association at LEU2. The percent of Leu prototrophs with a CO in the HIS4-iHYG@CEN interval was plotted against overall CO values. The solid black line represents a least squares fit to the data. The formula used for the least squares fit is a second order polynomial.

