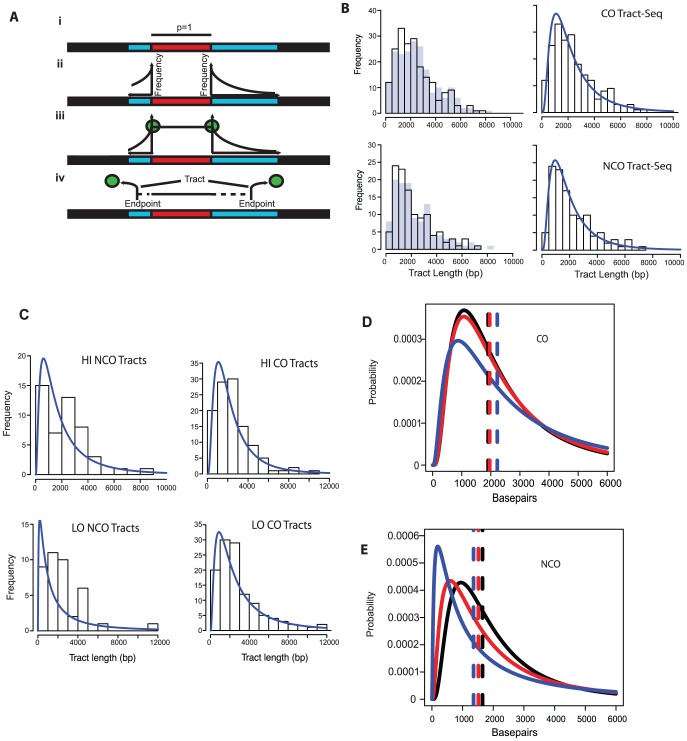
Figure 4. Tract-Seq and summary of sequence data.
A. Tract-Seq analysis to generate an estimated tract length, given maximal and minimal tracts. The red rectangle depicts the minimal tract length (“core”) in which reflects a contiguous stretch of 1∶3 markers and blue rectangles on either side of the core represent the regions in which the tract endpoints must be located. (i) The enzymatic resection machinery has processed through the minimal tract. (ii) Assuming a bidirectional enzyme with a symmetric enzymatic processivity, the probability of the enzyme falling off on either side of the core region follows a decreasing exponential law. (iii) Enzymatic complexes (green balls), initially located at the edges of the core region, fall off independently on each side of the core. (iv) The enzymes fall off before reaching the boundaries of the maximal tract. The estimated tract spans the distance between the two endpoints, encompassing the core interval. B. Analysis of wild-type tracts. Left: Histograms of midpoint-estimated (grey bars) and Tract-Seq-estimated (black-outlined transparent bars) individual CO (top) and NCO (bottom) tract lengths. Right: Histograms of Tract-Seq-estimated individual CO (top) and NCO (bottom) tract lengths, with the overlaid best-fitted log-normal distributions of GC tract lengths for each case. C. Histograms of Tract-Seq-estimated (black-outlined transparent bars) of individual NCO (left) and CO (right) tract lengths, along with the overlaid best-fitted log-normal distributions of GC tract lengths for Hi (top) and LO (bottom) mutants. D and E. Tract-Seq was used to estimate tract lengths for GC events associated with COs (D) and for NCOs (E). The probabilities of tracts of different lengths are plotted against tract length (in base pairs). Simulations based on WT (black line), HI (red line) and LO (blue line) tetrads are graphed, and respective means (dotted lines) are shown. Means and 95% confidence intervals are presented in Table 2. A log normal distribution was used to fit the distribution of tract lengths. The mean and standard deviation are the parameters needed to define each log normal distribution.

