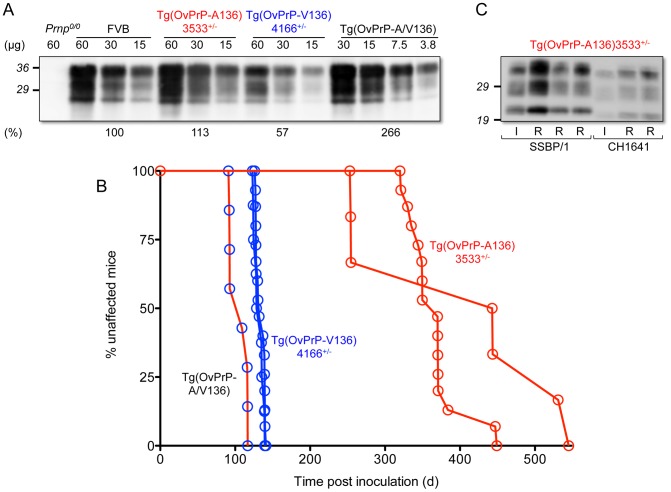
Figure 1. Characterization of transgenic mice expressing OvPrP-A136 and OvPrP-V136. A.
Levels of transgene-expressed OvPrP in the CNS were estimated by semi-quantitative western blotting using mAb 6H4. Amounts of total protein loaded (µg) in each sample are shown. Prnp0/0, mice in which the PrP gene is disrupted; FVB, wild type mice. Estimates of expression levels, shown as a percentage (%) of that in FVB mice, are based on densitometric analysis of signals from diluted samples. B. Survival curves of mice following inoculation with sheep SSBP/1 scrapie prions. Percent (%) affected mice refers to numbers of mice within an inoculated cohort manifesting progressive clinical signs associated with prion disease. C. Western blot analysis of PK-treated brain extracts of diseased Tg(OvPrP-A136)3533+/− mice. SSBP/1 and CH1641 refer to mice inoculated with the respective prions. I and R refer to sheep SSBP/1 or CH1641 inocula, and brain extracts from recipient mice respectively.

