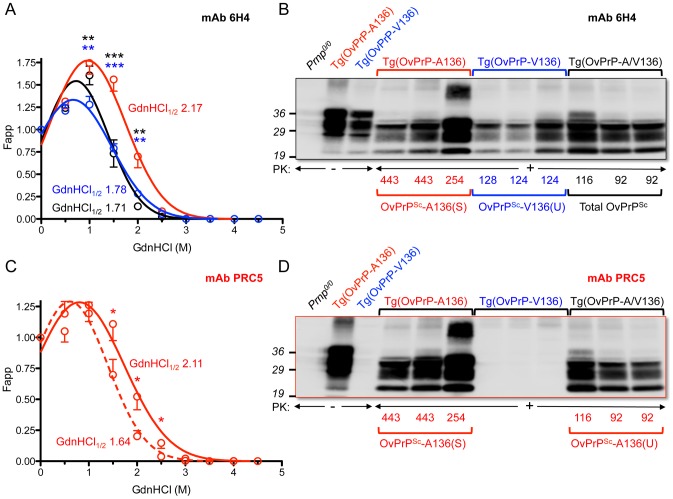
Figure 2. Analyses of PrPSc in the brains of SSBP/1 infected mice.
In A and C, densitometric analysis of immunoblots was used to measure the amounts of protease-resistant OvPrPSc as a function of GdnHCl concentration. The dose-response curve was plotted using a Gaussian non-linear least-square fit. Each point is the mean value derived from densitometric quantification of PK-resistant PrP in three diseased mouse brains. Error bars correspond to standard errors of the mean. A. Conformational stability analysis using mAb 6H4 of OvPrPSc-A136(S) in Tg(OvPrP-A136)3533+/− mice (red line), OvPrPSc-V136(U) in Tg(OvPrP-V136)4166+/− mice (blue line), and total OvPrPSc in Tg(OvPrP-A/V136) mice (black line). Black asterisks compare differences between OvPrPSc-A136(S) and total PrPSc in Tg(OvPrP-A136)3533+/− and Tg(OvPrP-A/V) mice; blue asterisks compare differences between OvPrPSc-A136(S) in Tg(OvPrP-A136)3533+/− mice and OvPrPSc-V136(U) in Tg(OvPrP-V136)4166+/− mice. C. Conformational stability analysis using mAb PRC5 of OvPrPSc-A136(S) in Tg(OvPrP-A136)3533+/− mice (solid line) and OvPrPSc-A136(U) in Tg(OvPrP-A/V136) mice (dashed line). *P<0.05, **P<0.005, ***P<0.001. In B and D, representative immunoblots of PK-resistant PrP in the brains of three mice from each infected cohort of Tg(OvPrP-A136)3533+/−, Tg(OvPrP-V136)4166+/−, and Tg(OvPrP-A/V136) mice using mAb 6H4 (B) and mAb PRC5 (C). Times of onset of disease for analyzed mice are also provided. OvPrP-V136 is indicated by blue symbols and text; OvPrP-A136 is indicated by red symbols and text.

