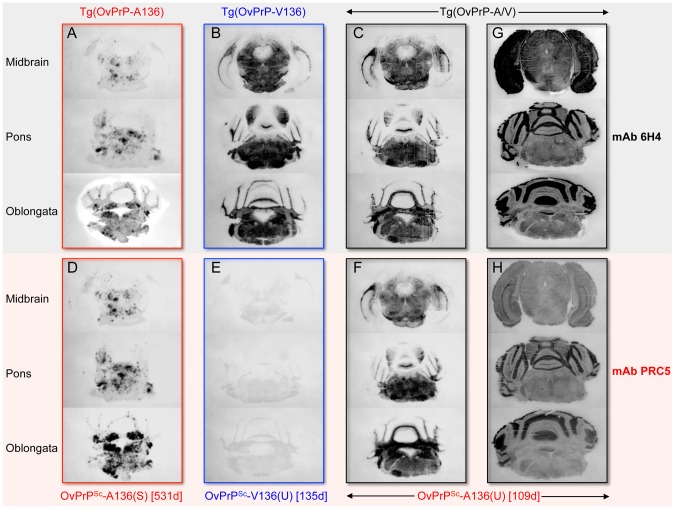
Figure 3. Representative OvPrPSc distribution in the CNS of diseased transgenic mice.
OvPrP-V136 and OvPrP-A136 are indicated by blue and red text respectively. Times of onset of disease (d) for individual mice analyzed in histoblots are provided. Sections through the midbrain, pons and oblongata are shown for SSBP/1 infected Tg(OvPrP-A136)3533+/− mice (A and D); Tg(OvPrP-V136)4166+/− mice (B and E); and Tg(OvPrP-A/V) mice (C and F). In panels G and H, sections were not treated with PK and show distribution of total PrP. Histoblots in panels A–G were probed with mAb 6H4; histoblots in D–H were probed with mAb PRC5.

