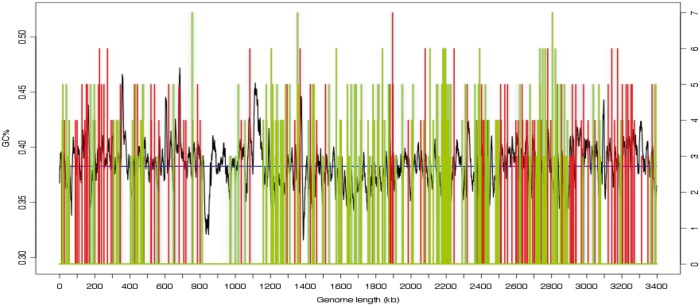
Figure 3.
Schematic representation of putative T4 effectors in the L. pneumophila genome according to G + C content. This representation is an output file automatically generated by S4TE. The mean GC% is indicated by the blue line. Putative effectors in genomic regions with low G + C content are in green and those in regions with high G + C content are in red.

