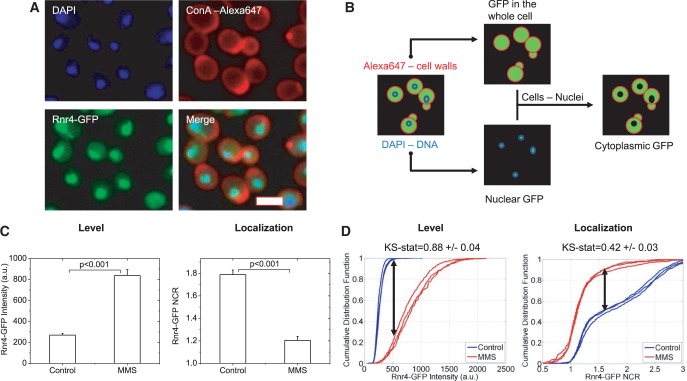
Figure 1.
Overview of sample preparation and analysis. Plates are prepared in triplicate for control and MMS-treated samples (0.02%, 3 h). (A) Samples are fixed and stained with DAPI to mark nuclei and Alexa-647-conjugated Concanavalin A to mark cell walls. Automated imaging is performed on a Cellomics HCSTM fluorescence microscope. A typical raw image is shown for the Rnr4-GFP strain. Scalebar 5 µm. (B) Schematic of image analysis protocol. Raw cell-wall and DNA fluorescence images are used to segment cellular and nuclear boundaries. Mean GFP pixel intensity is evaluated in the full cellular image mask to determine relative protein abundance. The ratio of intensities between the nuclear and cytoplasmic masks is used to determine the NCR on a cell-by-cell basis. (C) Mean response of Rnr4-GFP to DNA damage in terms of both levels and localization. Protein is induced as measure by autofluorescence (AF)-corrected levels and the NCR decreases significantly indicating that the Rnr4-GFP translocates to the cytoplasm on damage. Error bars are standard deviations of the means from the three replicates. P-values are determined using a Student’s t-test. (D) Mean response over cells does not account for the distinct distributions over cell populations. Thus, the same sample as in (C) is evaluated using the KS statistic. The KS statistic is a measure of the maximum distance between the normalized cumulative distribution histograms (indicated by the black double-headed arrows). The KS statistic is independently evaluated for each sample pair. Again, a significantly higher expression and cytoplasmic translocation of Rnr4-GFP is seen with DNA damage by MMS. In all instances, a KS-statistic cutoff of 0.3 is used. At least 200 cells are measured for each curve here.

