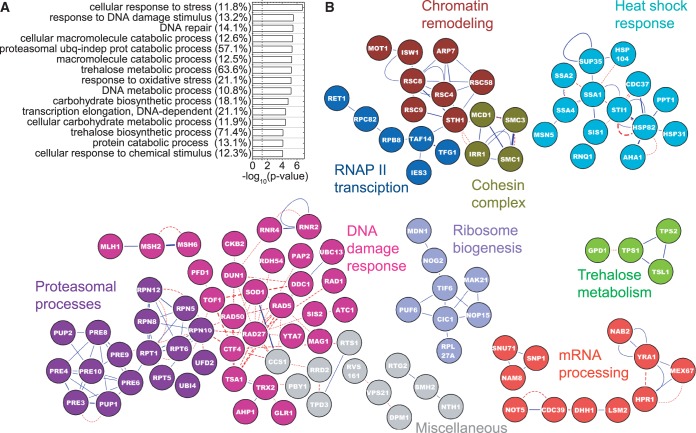
Figure 2.
Functional enrichment and protein–protein interactions of induced proteins. Proteins that showed fold change, f ≥ 1.5 and passed the statistical criteria were used. (A) The top 15 functional categories as determined by a GO analysis using Cytoscape are shown. Negative logarithms to the base 10 of the P-values for the GO terms are plotted. Numbers in parentheses show the percentage of genes associated with a GO term, which are found to be induced. The dashed line shows the position of P = 0.05 in all figures. (B) Induced proteins are projected onto a yeast interactome. Blue lines denote physical protein–protein interactions, and red lines denote genetic interactions. The weakest edges have been removed to parse out isolated modules. Isolated single nodes are not shown. The text on the network is color coded to represent the broad cellular processes represented by the corresponding nodes. Gray nodes do not conform to these categories but are still not isolated single nodes.

