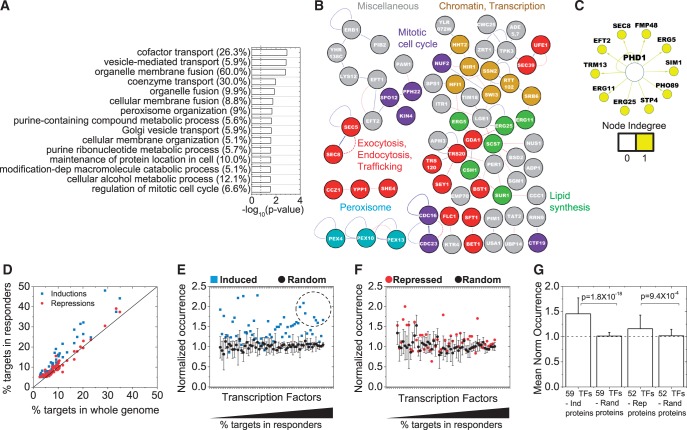
Figure 4.
Functional enrichment, protein interactions of the repressed proteins and comparison of TF interactions with induction responders. Proteins that showed fold change, f ≤ 0.75 and passed the statistical criteria were used. (A) Top 15 GO categories; (B) Protein–protein interaction networks; and (C) TF interaction networks for the repressed protein responders. The weakest links by edge weight have not been removed in the interaction network in (B), otherwise all representations are similar to Figure 2. Numbers in parentheses illustrate the percentage of genes associated with a GO term. (D) Fifty-two TFs, each of which controls the expression of at least 5% of the repressed proteins, were identified. Major TFs that target the repressed proteins are largely similar to those that target the induced proteins (47/52 TFs). The percentages of targets for TFs in the induction and repression responder lists are plotted against the percentage of targets from the whole genome. Each dot represents a TF, with the solid black line illustrating the 1:1 line expected by random chance. The percentage of targets in the responder lists are divided by the percentage targets in the whole genome for these TFs factors for the (E) Induced and (F) Repressed proteins. This ‘normalized occurrence’ should be one in the absence of specific enrichment or depletion of the targets of a TF in a list of genes. For comparison, we generated five random networks of the same size as the Induced or Repressed protein lists and analyzed them similarly for targets of the chosen major TFs. The means and standard deviations of these random samples are plotted in black. For many TFs, the normalized occurrence in Inductions lies beyond the standard deviation of the normalized occurrence of the random samples. TFs with higher percentage of targets among the induced or repressed proteins are on the right. The dashed circle marks TFs that have both high normalized occurrence and a large number of targets in the genome (Yap1, Met4, Rpn4, Msn2, Msn4, Hsf1 and Pdr3). Many of these are stress-responsive TFs. (G) The mean and standard deviation of normalized occurrence from (E) and (F) for all TFs are plotted. The dashed line shows the expected value for random networks.

