Figure 5.
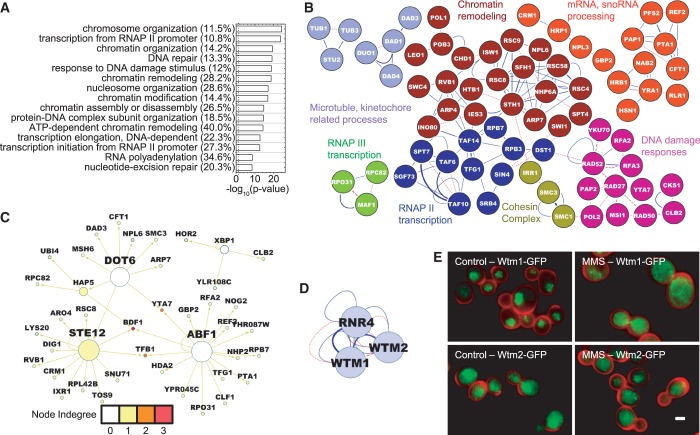
Functional enrichment and protein–protein and TF interactions of the nuclear or cytoplasmic enrichment responders. (A) The nuclear enriched protein list exhibits very significant enrichment of DNA-related terms, despite being smaller in size than both induction and repression responder lists. Top 15 GO terms are shown. The numbers in parentheses show the percentage of genes associated with a GO term. (B) The protein–protein interaction networks too show functionally clustered modules. The weakest links have been removed like the induced proteins. In addition to DNA damage responsive proteins, a large number of chromatin remodelers, transcription components and mRNA processing proteins make up this network. (C) The TF network identifies two additional TFs, Ste12 and Abf1. (D) Rnr4, Wtm1, Wtm2 make a close connected network in the few cytoplasm-enriched proteins. (E) The cytoplasmic translocation of Wtm1-GFP or Wtm2-GFP shown with high resolution 100 × 1.4 N.A. images. The cell wall is shown in red, whereas the GFP-tagged protein is shown in green. Many cells show cytoplasmic protein upon MMS treatment, whereas some still have nuclear protein. The scalebar is 2 µm. Representations in (B), (C) and (D) are similar to Figure 2.

