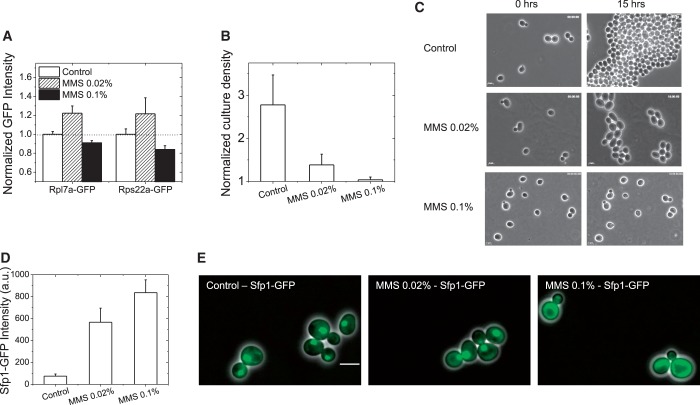
Figure 6.
Differential response of RPs to different levels of MMS damage. The response of two candidate induced RPs (Rpl7a-GFP, Rps22a-GFP) to MMS damage was investigated with live-cell flow cytometry, at 2 h. (A) At 0.02% MMS, the RPs are induced, whereas at the higher dose (0.1%), they are repressed. (B) Parental BY4741 cells were subjected to similar treatments, and culture densities (events/µl) were determined by flow cytometry (optical density measurements are expected to be not accurate at these early time points, as MMS arrest can cause an increase in cell-size). For three early log-phase cultures, initial densities were measured, and a third of each culture was subjected to 0, 0.02%, 0.1% MMS treatment. All densities at 2 h are normalized by the density of the initial cultures. 0.02% MMS significantly retards growth, but does not abrogate it altogether, whereas there is almost no growth in the presence of 0.1% MMS. (C) In a different assay from liquid cultures, even for cells growing on agar-pads with or without MMS, there is slow growth with 0.02% MMS, whereas no growth is seen at 0.1% MMS. Images of the same fields at 0 and 15 h are shown. (D) The GFP-tagged TF Sfp1, which controls RP gene expression, is induced at both doses of MMS as determined by live-cell flow cytometry. AF-corrected intensities are plotted; however, the expression of the protein is low in the absence of damage, making estimations of fold change difficult. (E) At 0.02% MMS, the protein is still nuclear, whereas at 0.1% MMS, it is clearly cytoplasmic, concomitant with the induction and repression of the RP proteins. Live cells were imaged with a 100× oil-immersion objective, given the low expression of the protein. Overlays of GFP and phase images are presented. The scalebar is 5 µm.

