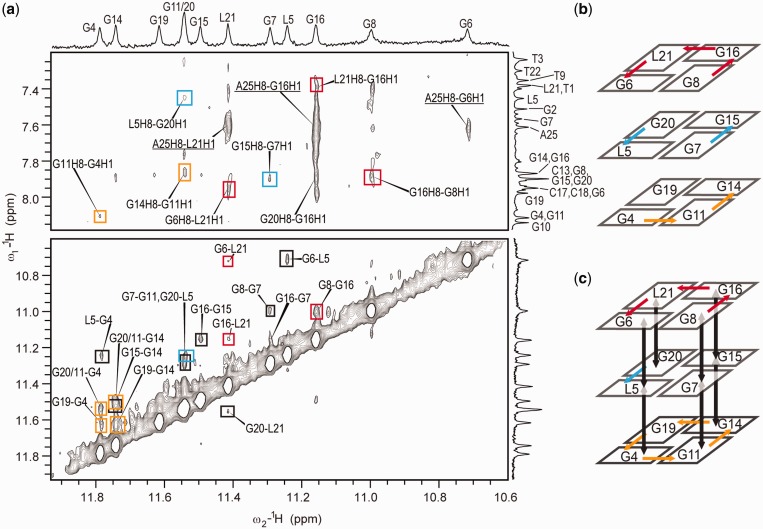
Figure 3.
(a) Imino–aromatic and imino–imino regions of 2D NOESY spectrum (τm = 250 ms) of RNV66 with resonance assignment indicated along 1D traces. Cross-peaks labeled with red, blue and orange rectangles correspond to the G6-G8-G16-L21, L5-G7-G15-G20 and G4-G11-G14-G19 quartets, respectively. Cross-peaks labeled with black rectangles correspond to correlations between sequential residues within a G-quadruplex core. Underlined assignments correspond to the correlations of residues involved in loop and flanking regions. Spectrum was recorded at 800 MHz, 25°C in 10% 2H2O, 50 mM K+, 10 mM KPi buffer with pH 7 and oligonucleotide concentration of 0.5 mM. Schematic presentations of observed NOE connections for imino–aromatic and imino–imino regions are shown in (b) and (c), respectively. Colors of the arrows correspond to the color of the NOE cross-peaks in panel (a).

