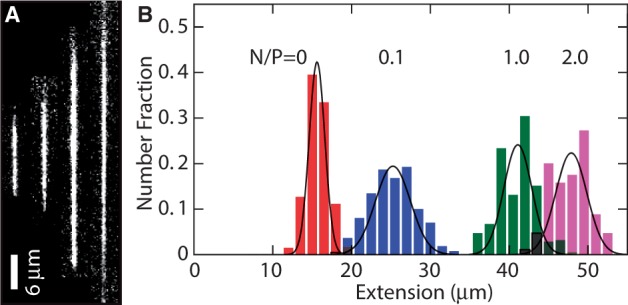
Figure 3.

(A) Montage of fluorescence images of T4-DNA in 250 × 250 nm2 channels and in 10 mM Tris/HCl (pH 8.5). From left to right, N/P = 0 (polypeptide-free), 0.1, 1.0 and 2.0. The scale bar denotes 6 μm and the YOYO-1 intercalation ratio is 100 bp per dye molecule. (B) Distribution in extension of a population of ∼50 T4-DNA molecules with indicated N/P ratio. Gaussian fits give mean extensions of  = 16 ± 2, 25 ± 3, 41 ± 3 and 48 ± 3 μm for N/P = 0, 0.1, 1.0 and 2.0, respectively.
