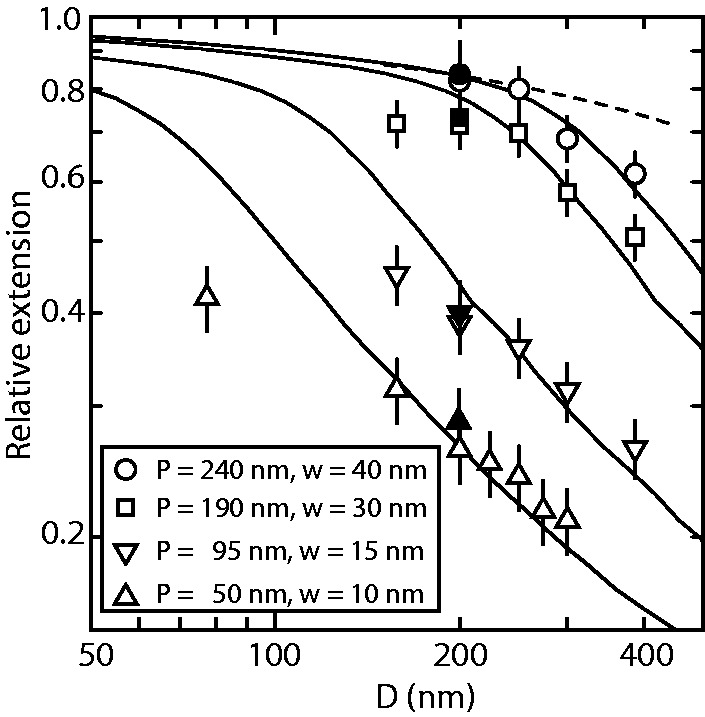
Figure 4.

Relative extension  of T4-DNA (open symbols) and λ-DNA (closed symbols) in 10 mM Tris/HCl versus channel diameter D. The N/P ratios are 0 (▵), 0.1 (▿), 1.0 (□) and 2.0 (○). The solid curves represent Monte Carlo results with noted values of persistence length P and width w. The dashed curve represents deflection theory for narrow channels.
