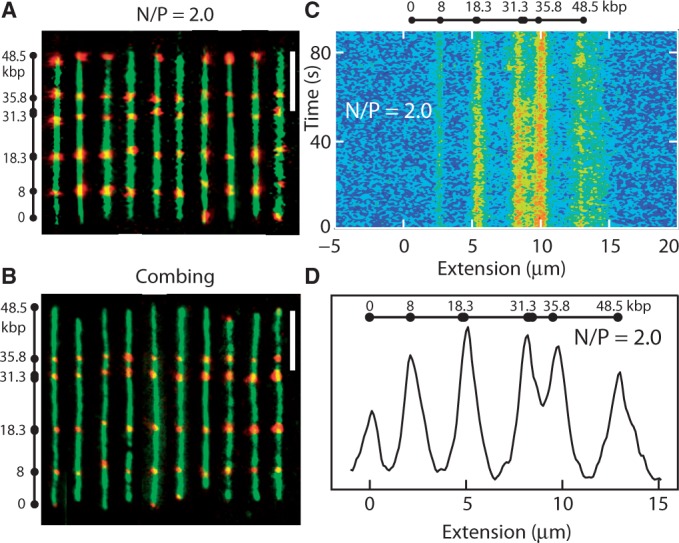
Figure 5.

(A) Montage of fluorescence images of λ-DNA. The images obtained with YOYO-1 (green) and Alexa Fluor 541 (red) staining are superposed. The molecules are confined in 150 × 250 nm2 channels with N/P = 2.0. Labelling sites are noted. The scale bar denotes 5 μm. (B) As in panel (A), but for combed λ-DNA. (C) Time dependence of the Alexa Fluor intensity profile pertaining to N/P = 2.0 and in a 150 × 250 nm2 channel. The exposure time is 500 ms. (D) Average Alexa profile over a pool of 50 molecules with N/P = 2.0 and in 150 × 250 nm2 channels.
