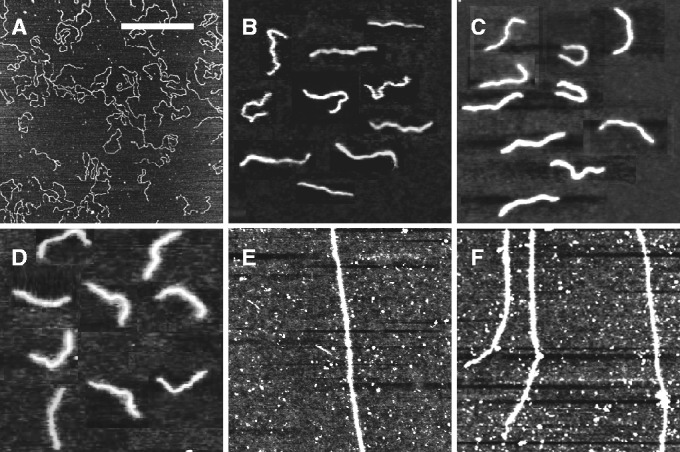
Figure 6.

(A–D) Tapping mode atomic force microscopy images of linearized pUC18 DNA complexed with increasing amounts of polypeptide. The N/P ratios are 0, 0.1, 1.0 and 2.0, in panels A, B, C and D, respectively. (E, F) As in panels (A–D), but for  DNA with N/P = 2.0. The scale bar denotes 1 μm. Panels B–D are a montage.
