
Figure 7.
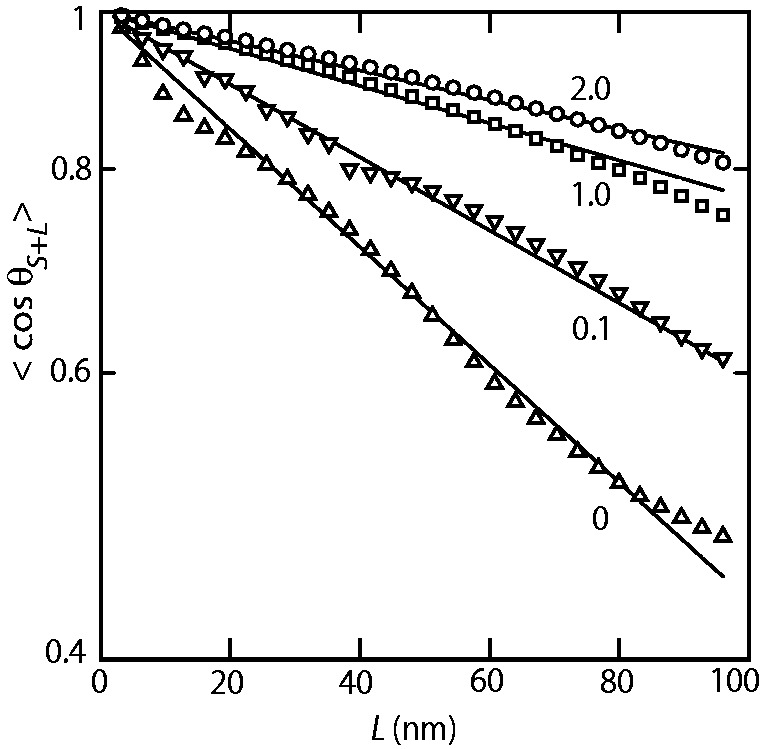
Orientation correlation of the tangent vectors at a pair of points separated by distance L along the contour. The lines represent exponential fits, and the polypeptide to DNA N/P ratios are noted. The fitted values of the persistence lengths P = 60 ± 5, 95 ± 5, 190 ± 10 and 240 ± 10 nm for N/P = 0, 0.1, 1.0 and 2.0, respectively.