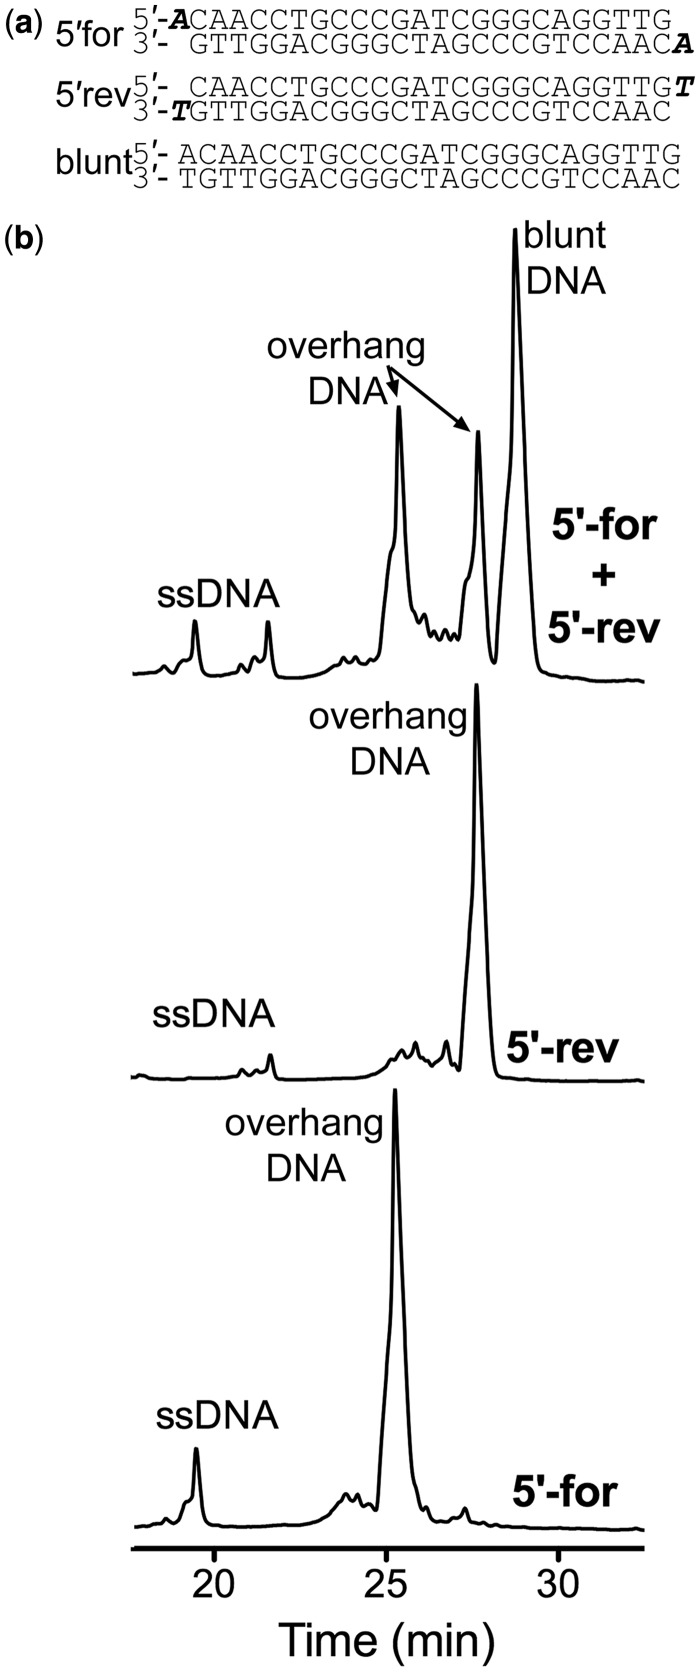
Figure 3.
Separation of 5′ single base pair overhang palindromic DNA. (a) Top: 5′-forward palindromic strand annealed to itself with the adenine overhang base highlighted in bold italics. Middle: 5′-reverse palindromic strand annealed to itself with the thymine overhang base highlighted in bold italics. Bottom: Blunt DNA sequence of the 5′-forward and reverse palindromic strands. (b) Top: DNA elution profile of 0.25 mg of 5′-forward and 5′-reverse DNA after annealing. Blunt dsDNA can be separated from overhang dsDNA as well as ssDNA. The left overhang peak corresponds to 5′-forward self-annealed palidromic DNA, whereas the right overhang peak corresponds to 5′-reverse self-annealed palindromic DNA. Middle: DNA elution profile of 0.25 mg of 5′-reverse self-annealed palindromic DNA alone. Bottom: the DNA elution profile of 0.25 mg 5′-forward self-annealed palindromic DNA alone. The acetonitrile gradient for all spectra was 5–12% over the course of 40 min.

