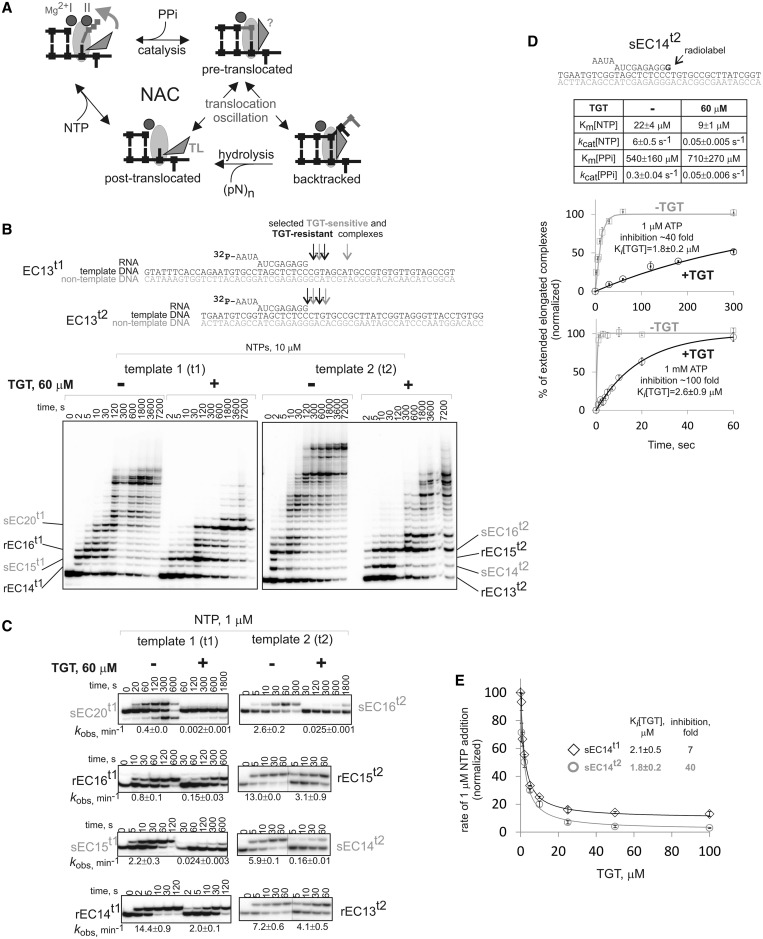
Figure 1.
Inhibition by TGT depends on the transcribed sequence. (A) Scheme of the NAC and translocation oscillation of the elongation complex between post-translocated, pre-translocated and backtracked states. The states of the TL (folded-vertical versus unfolded-horizontal) are shown based on biochemical and crystallographic data, except for pre-translocated state, conformation of the TL in which is not known. Note the reactions that are catalyzed in each translocation state. (B) Transcription in the absence or presence of TGT in elongation complexes of unrelated transcribed sequences (t1 and t2, shown above the gels; RNA was labeled at the 5′-end). Depicted are sECs and rECs analyzed in our study. (C) Kinetics of NTP incorporation in sECs and rECs in the presence or absence of TGT. Observed rate constants (kobs) are shown below gels (numbers that follow the ± sign are standard errors). Note that division of complexes into sECs and rECs is formal, and a broad distribution of TGT sensitivity is observed (see also Figure 2B). (D) Characteristics of TGT action analyzed in sEC14t2 (scheme at the top; radiolabel is in bold): inhibition of incorporation of 1 µM and 1 mM NTP in the absence or presence of TGT (error bars are standard deviations); Ki[TGT] in the presence of 1 µM and 1 mM NTP; affinity and rate constants for NTP incorporation and pyrophosphorolysis in the absence and presence of TGT (numbers that follow the ± sign are standard errors). (E) Inhibition constants for two complexes with different extent of TGT inhibition (error bars are standard deviations, numbers that follow the ± sign are standard errors).

