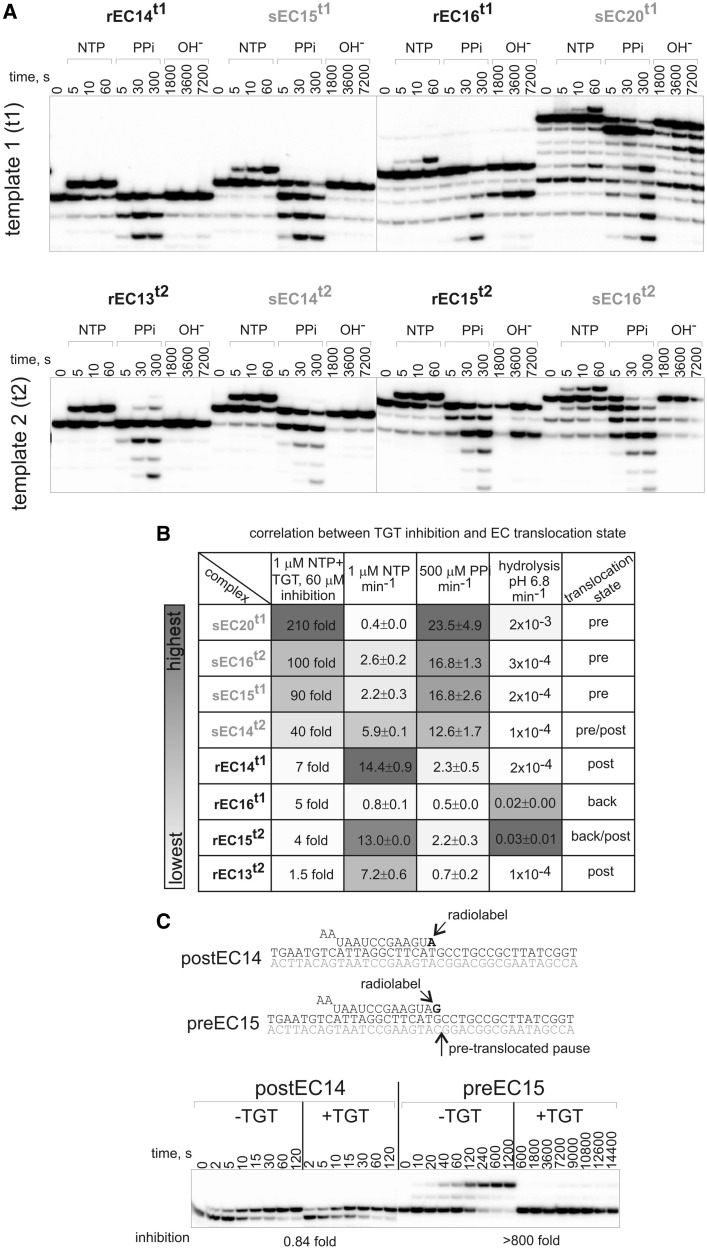
Figure 2.
TGT targets the pre-translocated state of elongation complex. (A) Kinetics of NTP (1 µM) incorporation, pyrophosphorolysis (500 µM PPi) and phosphodiester bond hydrolysis in sECs and rECs. Representative gels are shown. (B) Summary of results on inhibition by TGT and the rates of reactions (kobs) in sECs and rECs (numbers that follow the ± sign are standard errors). Shades of gray in the ‘heat map’ reflect magnitude of effects: darkest gray corresponds to strongest inhibition of NTP addition by TGT or highest rates of reactions in the absence of TGT. Note the correlation between extent of inhibition of NTP addition by TGT and the rate of pyrophosphorolysis. The right column roughly shows the distribution between translocation states in elongation complexes, deduced from the rates of reactions. (C) Kinetics of NTP (1 µM) incorporation in the presence or absence of TGT in elongation complexes stabilized in the post-translocated (postEC14) and the pre-translocated (preEC15) states (12). Extent of inhibition by TGT is shown below gels.

