Figure 4.
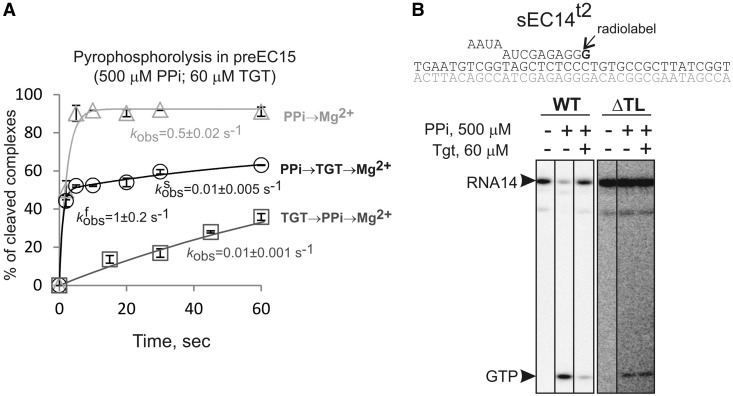
TGT/TL blocks PPi entry to the active center. (A) Kinetics of pyrophosphorolysis in preEC15 (error bars are standard deviation). PPi (500 µM) was added without TGT (light gray triangles), after TGT (dark gray squares) or before TGT (black circles). Reactions were started with Mg2+. Data for ‘light gray’ and ‘dark gray’ curves were fitting well in single-exponential equation. The ‘black’ kinetics clearly had two phases and was fitted into double exponential equation. The observed rate constants are shown next to plots (numbers that follow the ± sign are standard errors). For ‘black’ plot, constants for both slow and fast, fractions are shown. (B) TGT (60 µM) inhibits pyrophosphorolysis (500 µM) by wild-type RNAP (10 s), but not by RNAP lacking entire TL, ΔTL (2 h).

