Figure 3.
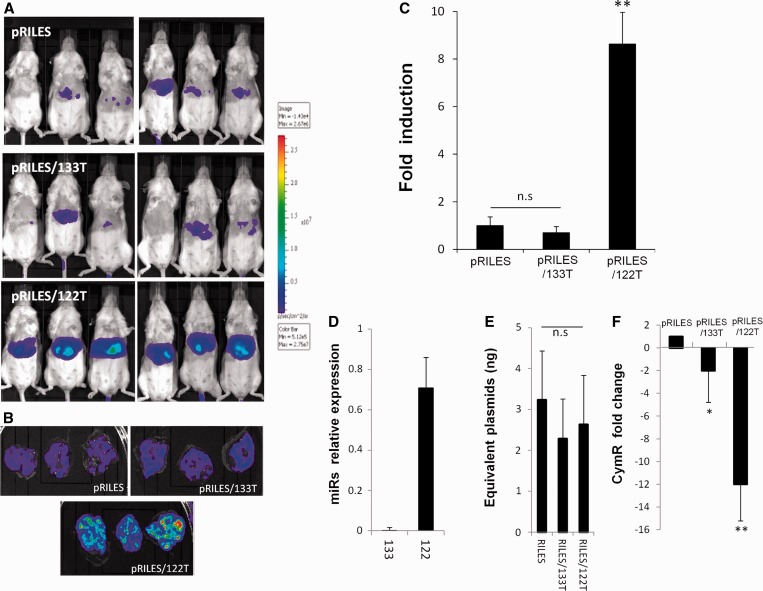
Noninvasive bioluminescence imaging of the liver-specific miRNA-122 in mice. Fifty micrograms of pRILES/122T and pRILES/133T were hydrodynamically injected in Swiss mice to transfect the liver. Negative control included the pRILES, not regulated by miRNA. Bioluminescence imaging was performed 3 days later and light emission quantified using ROIs covering (A) the whole abdominal cavity of the mice or (B) the liver of one representative mouse per group. (C) Quantitative bioluminescence values detected in mice described in A and expressed as luciferase induction relative to the control pRILES group of animals set arbitrarily to the value of 1. (D) Quantitative RT-PCR analysis of miRNA expression in the liver tissues of another group of mice. (E) Absolute quantification of plasmid content in the liver tissues of the mice described in B. (F) Quantitative RT-PCR analysis of CymR expression in the liver tissues of the mice described in B. Results are expressed as CymR fold change relative to control pRILES-tissues set arbitrarily to the value of 1. Error bars in C, mean ± SEM (n = 6) of one representative experiment repeated two times. Error bars in D, E, F mean ± SD (n = 3) of one representative experiment repeated at least three times. Statistics by the two-tailed t-test, *P < 0.05; **P < 0.01, n.s (no statistically significant difference) compared with the pRILES control group.

