Figure 1.
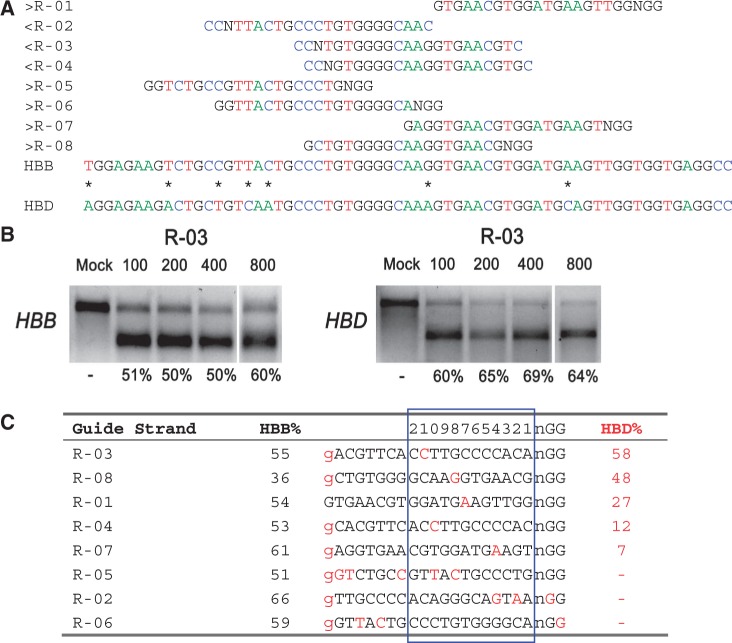
On- and off-target cleavage by CRISPR/Cas9 systems targeting the HBB gene. (a) Guide strands are aligned to their target sites and corresponding region in HBB and HBD. Forward direction guide strands (marked ‘greater than’) are shown adjacent to NGG, representing the PAM sequence. Guide strands complementary to the reverse strand (marked ‘less than’) are listed to the right of CCN. Asterisks between HBB and HBD indicate nucleotides that differentiate the two genes. The first base shown in HBB is the sickle cell anemia mutation site. For clarity, the A, C, T and G nucleotides are shown in green, blue, red and black, respectively. (b) R-03-induced cleavage at HBB (on-target) and HBD (off-target) measured by the T7E1 assay. Cells were transfected with 100, 200, 400 or 800 ng of the R-03 CRISPR plasmid. (c) Guide strands ranked in order of the off-target mutation rates at HBD. Differences between the guide sequence and HBD are in red. A lowercase g indicates that the first base in HBB does not match the guide strands’ initial G (for all but R-01). The 12 bases closest to the PAM are boxed in blue and numbered on top.

