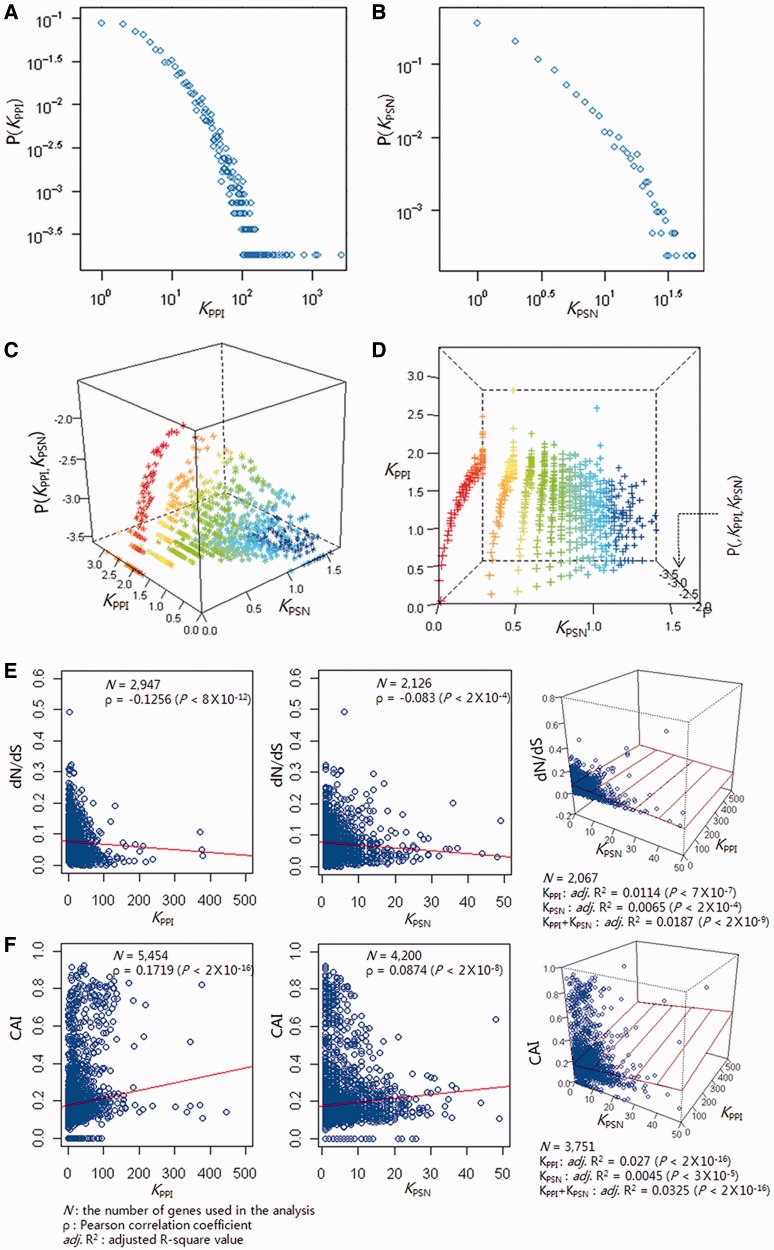
Figure 1.
Degree distribution and evolutionary conservation within biological networks. The (A) protein interaction and (B) perturbation sensitivity networks are both scale-free with approximate exponents of 2.48 (γPPI) and 2.24 (γPSN), respectively. (C and D) The three-dimensional plots demonstrate that the two distinct networks are reciprocally intertwined to constitute a curved surface. Nodes are coded with different colors according to node degrees (KPPI and KPSN). Scatter plots between the node degrees (KPPI and KPSN) and (E) the protein evolutionary rate (dN/dS) and (F) the CAI demonstrate that hubs of both networks are under high evolutionary selection pressure.

