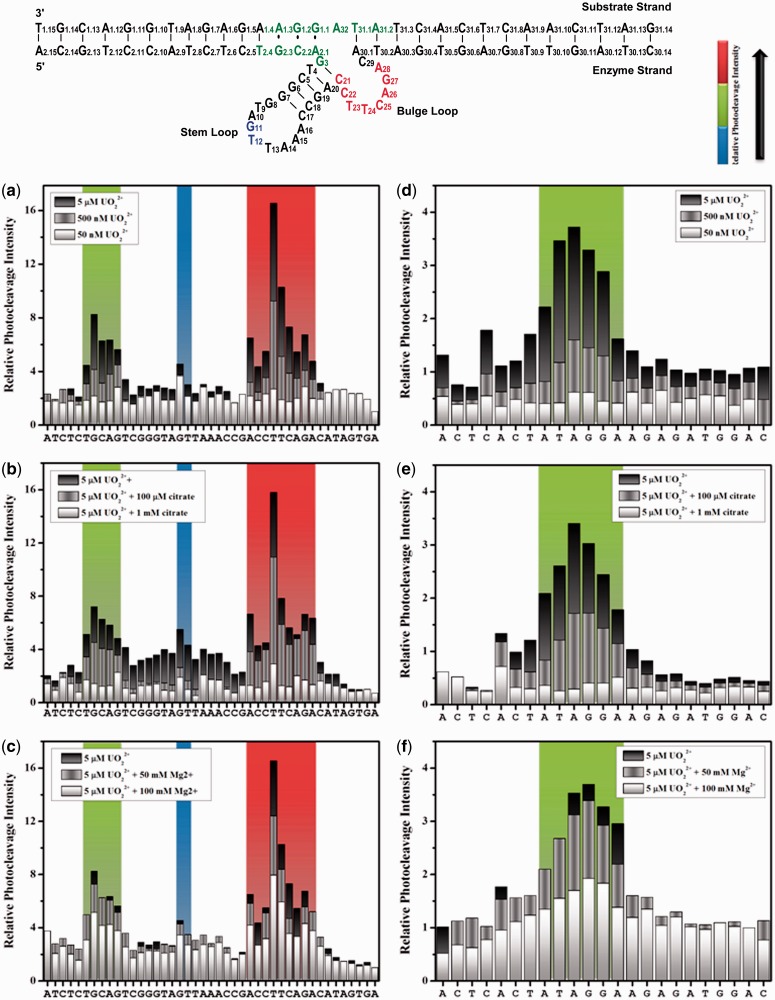
Figure 4.
Uranyl photocleavage of 39E (−1, +5) DNAzyme with either the enzyme strand (a–c) or the substrate labeled (d–f). Plots display strand sequences from 5′ end to 3′ end. Plots (a–c) show the 39E (−1,+5) enzyme strand sequence from A2.9 to A30.7. Plots (d–f) show the 39DS (+5,−1) substrate strand sequence from A31.9 to C1.13. The gel images were quantified by SAFA, with the horizontal axis indicating the bands from 5′ to 3′ end according to Figure 1b. Colors represent the intensity of photocleavage, red (high), green (intermediate) and blue (low) according to regions in the secondary structure of the 39E/S complex. (a) Uranyl-mediated photocleavage of 39E DNAzyme with the enzyme strand labeled and in the presence of 5 µM (Black), 500 nM (gray) and 50 nM (white) of uranyl. (b) Uranyl-mediated photocleavage of 39E DNAzyme with the enzyme strand labeled and in the presence of 5 µM uranyl in addition to increasing concentrations of sodium citrate. 5 µM uranyl (black), 5 µM uranyl in addition to 100 µM sodium citrate (gray) and 5 µM uranyl in addition to 1 mM sodium citrate (white). (c) Uranyl-mediated photocleavage of 39E DNAzyme with the enzyme strand labeled and in the presence of 5 µM uranyl (black) in addition to magnesium chloride, 1 mM Mg2+ (gray) and 10 mM (white). (d) Uranyl-mediated photocleavage of 39E DNAzyme with 39DS substrate strand labeled and in the presence of 5 µM (Black), 500 nM (gray) and 50 nM (white) uranyl. (e) Uranyl-mediated photocleavage of 39E DNAzyme with the 39DS substrate strand labeled and in the presence of 5 µM uranyl in addition to an increasing concentration of sodium citrate, 100 µM citrate (gray) and 1.0 mM citrate (white). (f) Uranyl-mediated photocleavage of the 39E DNAzyme with 39DS substrate strand labeled and in the presence of 5 µM uranyl in addition to magnesium chloride, 1 mM Mg2+ (gray) and 10 mM (black).

