
Figure 5.
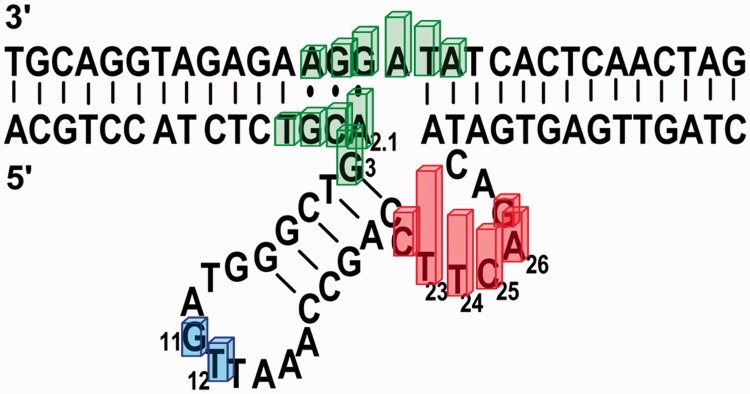
Schematic representation of the 39E DNAzyme (original sequence), summarizing the results from the uranyl photocleavage studies. Bars indicate bases that showed specific binding of uranyl in the photocleavage studies, color code is based on Figure 4.