
Figure 2:
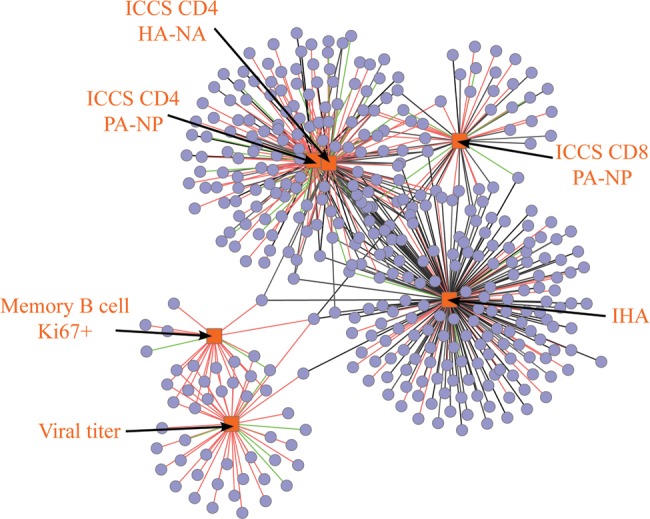
Cytoscape (Cline et al. 2007) rendering of Maximal Information Coefficient (MIC) (Reshef et al. 2011) results between gene expression data and the indicated immunologic and virologic measurements. All associations had MIC ≥ 0.8. Red/green edges indicate positive/negative correlations, respectively. Grey edges indicate nonlinear relationship. Measurements were performed on bronchial alveolar lavage samples from rhesus macaques infected with 2009 pandemic H1N1 influenza strain CA04 (exception of serum anitbody titers). HA-NA, viral hemagglutinin + neuraminidase; ICCS, intracellular cytokine staining; IHA, inhibition HA titer; PA-NP, viral polymerase component + nuclear protein.