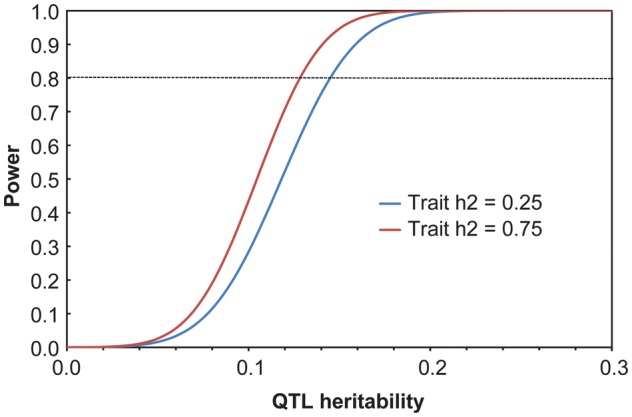
Figure 4.

Power of the pedigree to detect linkage to a locus influencing a quantitative trait with a log-of-odds score of 3 across a range of quantitative trait locus heritabilities using a maximum likelihood–based variance decomposition approach. Power for two traits with total heritabilities of 0.25 (blue) and 0.75 (red) is considered. Analyses conducted in SOLAR (v.4.2, Texas Biomedical Research Institute, San Antonio, TX).
