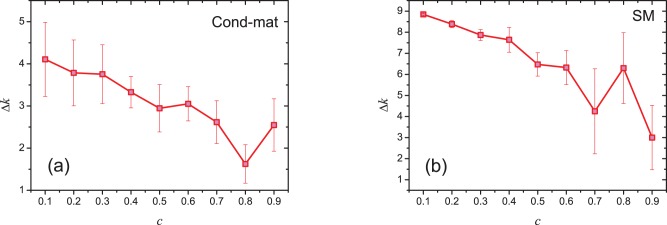
Figure 2. The increment of degree  in the period
  of nodes with the same degree (
 ) but different clustering coefficients at time
  .
.

 is the average value of a bin (size = 0.1) on clustering coefficient. For example, the value of
  corresponding to
  is the average value of
  of the nodes with clustering coefficient in
  . The error bars stand for standard errors.
