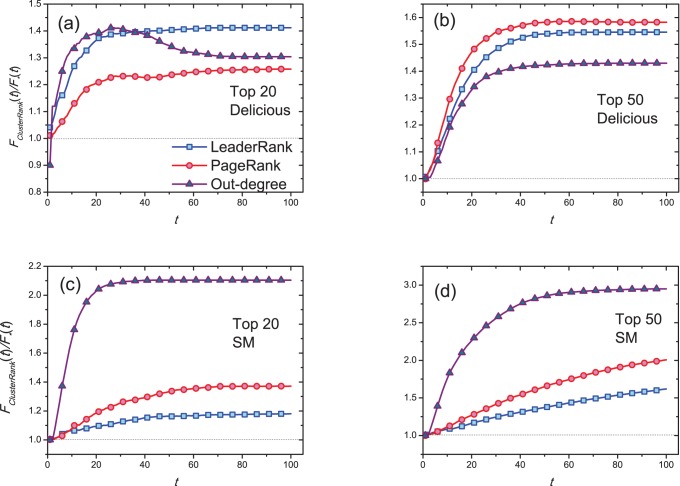
Figure 5. The ratio of the number of infected and recovered nodes by ClusterRank to those by out-degree centrality, PageRank and LeaderRank.
Initially only non-overlapped nodes in the top- lists obtained by ClusterRank and other ranking algorithms are set to be infected. We set
  and
and  . Each data point is obtained by averaging over 100 independent runs.

