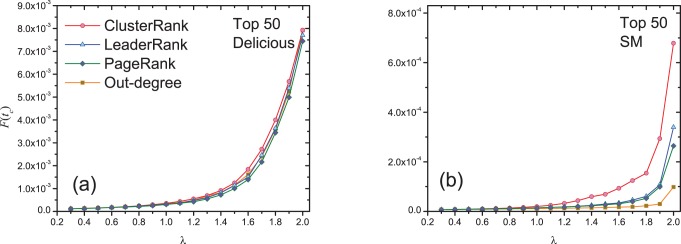
Figure 6. The dependence of  on parameter
  .
.

The initially infected nodes are the top-50 nodes obtained by out-degree centrality (squares), PageRank (diamonds), LeaderRank (triangles) and ClusterRank (circles). We set  . Each data point is obtained by averaging over 100 independent runs.
