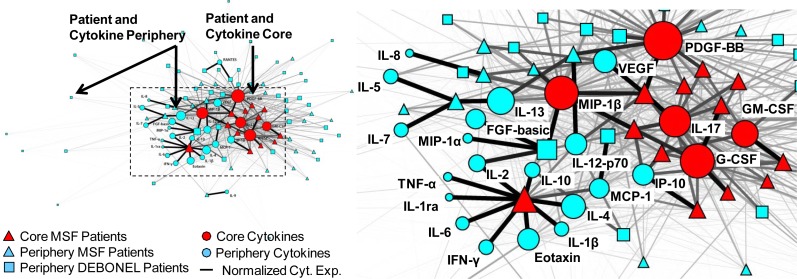
Figure 1.
A bipartite network (automatically laid out by the Kamada-Kawai algorithm10) shows how 26 cytokines (circular nodes) co-occur across 85 patients (square and triangular nodes). The size of the nodes is proportional to the sum of the edge weights (representing normalized cytokine values) that connect to them, and the thickness of edges is proportional to cytokine values. Therefore patients with high total cytokine values have large nodes, and higher cytokine values are represented by thicker edges. The network has a core-periphery topology (red=core, blue=periphery) for the patients, in addition to the cytokines.

