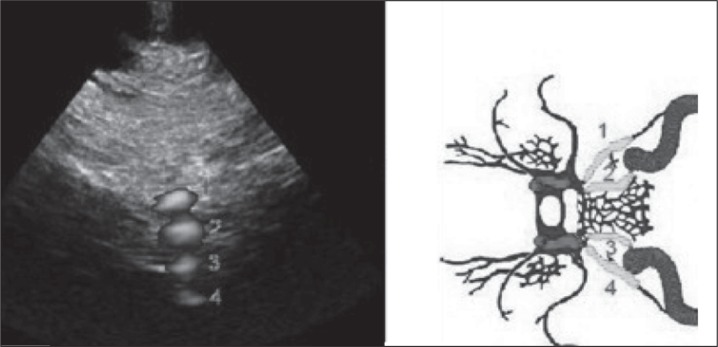
Figure 3 .
Visualization of the power Doppler signal (instead of color Doppler for increased spatial resolution) of the superior petrosal sinus ( 1 ), inferior petrosal sinus ( 2 ), contralateral inferior petrosal sinus ( 3 ) and (partially) contralateral superior petrosal sinus ( 4 ), from the transcranial window at the level of the condyloid process of the mandible.

