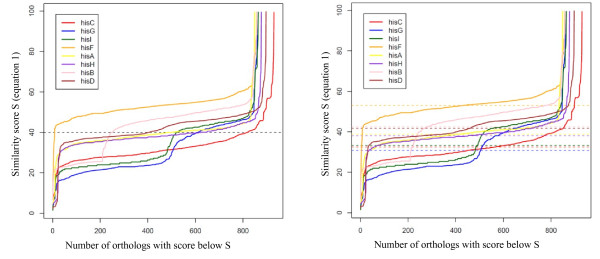
Figure 1.

Curves of sorted similarity score s (equation 1) for 8 genes of the B. subtilis histidine pathway. The x axis represents the number of orthologs of the target gene having a s score below y. Left panel: The same threshold (dashed black line at 40) for all genes is used. Right panel: Different thresholds chosen according to the average of s are used for each gene.
