
Figure 6.
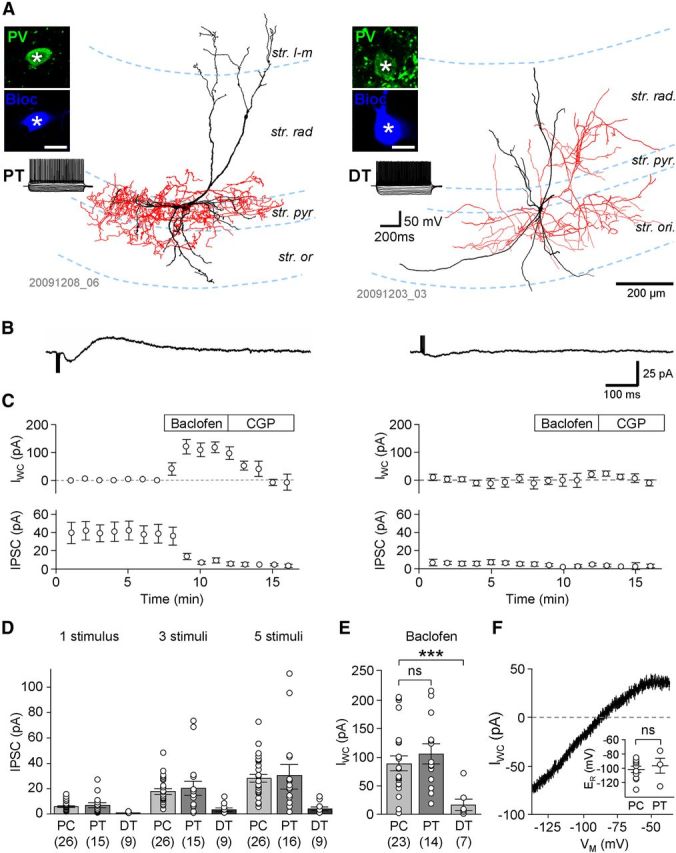
Differential expression of GABABR-mediated synaptic and whole-cell currents in PT and DT PVIs. A, Left: Reconstruction of a PT PVI, a putative basket cell, with dense axonal arbor (red) in the str. pyramidale (str. pyr.). Right: Reconstruction of a DT PVI, a putative bistratified cell, with axonal arbor (red) in the str. radiatum (str. rad.) and oriens (str. ori.). Insets show the immunoreactivity for PV (top, in green) in the visualized biocytin-filled cell bodies (bottom, blue pseudocolor; scale bar, 20 μm); traces show the responses of the two interneurons to a family of hyperpolarizing and depolarizing current pulses (−250 to 250 pA, 50 pA steps, 500 ms duration); note the FS discharge pattern of both cells. B, Pharmacologically isolated slow IPSCs evoked in the PT cell (left, average of 10 traces) and the DT interneuron (right) by trains of five extracellular stimuli delivered to the border of str. radiatum and str. lacunosum-moleculare (str. l-m). IPSCs had large amplitude in PT cells but were absent or had very small amplitudes in DT neurons. C, Time course plots of whole-cell current (IWC, top) and the IPSC amplitude (bottom) before and during sequential bath application of baclofen (10 μm) and CGP (5 μm) from a subset of PT cells (A, four cells) and DT cells (B, six cells) in which both drugs were applied. D, Summary bar graph of IPSC amplitudes in PCs and PT and DT PVIs elicited by single stimuli and trains of three and five stimuli. E, Summary bar graph of the baclofen-induced IWC measured in PCs and PT and DT interneurons. F, Representative plot of the voltage dependence of the baclofen-induced IWC in a PT interneuron. Voltage dependence was calculated by subtracting current responses to ramp commands after CGP and during application of baclofen. Inset, summary of reversal potentials (ER) of the baclofen-induced currents obtained from the calculated voltage dependence in PCs and PT neurons.