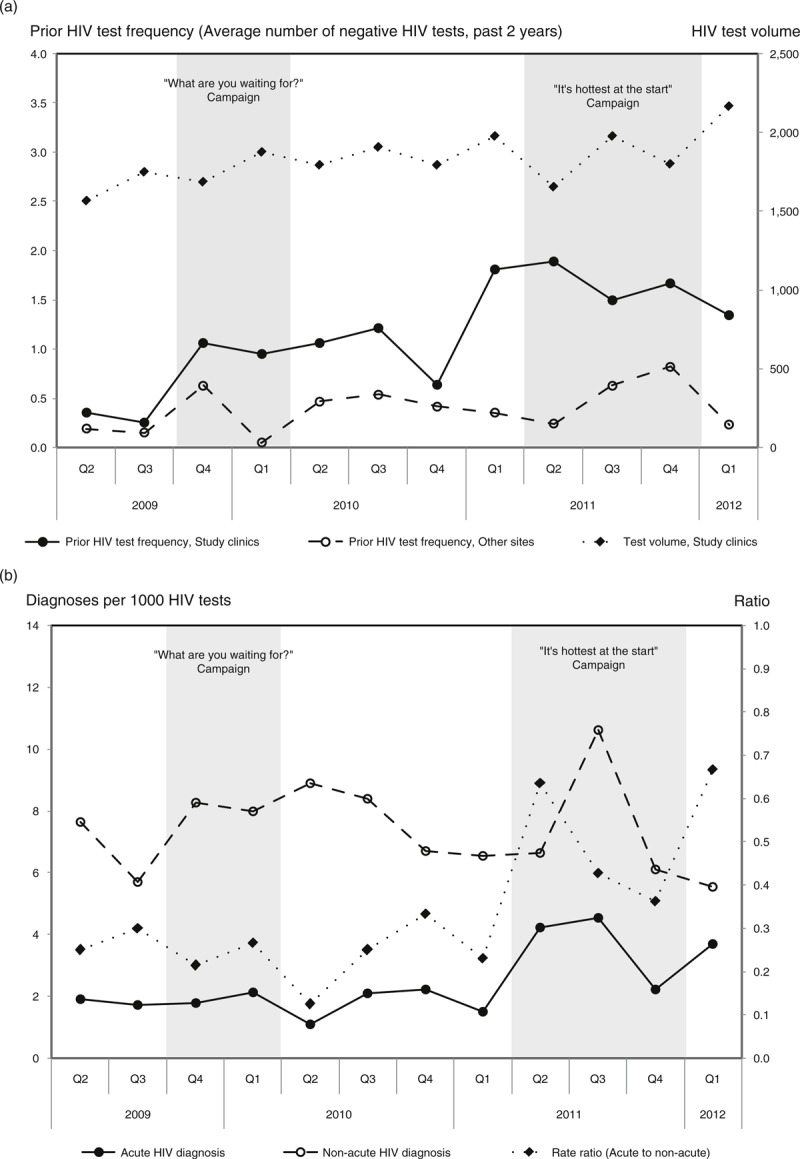
Fig. 1.
Test volume, prior HIV test frequency, and diagnosis rates after implementation of pooled nucleic acid amplification testing and social marketing campaigns, April 2009 to March 2012.

(a) Total HIV test volume (study clinics) and prior HIV test frequency among newly diagnosed MSM (at study clinics compared to other sites in British Columbia). (b) Acute and non-acute HIV diagnosis rate at study clinics. Explanatory footnote: Test volume and diagnosis rates based on individuals identified as male, transgender, or unknown sex, of age at least 19 years. Prior HIV test frequency calculated as the average number of HIV tests in the past 2 years for newly diagnosed MSM per quarter.
