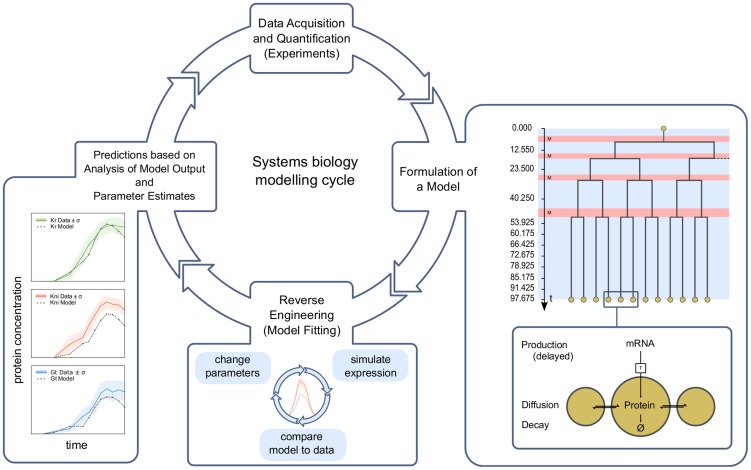
Figure 1. The systems biology modeling cycle.
This cycle illustrates the interplay of experiment and modeling in modern systems biology (adapted from [26]). Expression data are acquired and quantified. A model is formulated based on a regulatory hypothesis intended to explain the observed expression patterns. The model is solved and fit to data (reverse engineering). Model output and parameter values are then analysed to yield predictions and interpretations of the biological data. If necessary, the process is repeated—acquiring new data and improving the model—until a satisfactory explanation of the observed phenomena is achieved. Model fits are shown on the left. The panel describing the model depicts the processes of protein production, diffusion, and decay within and between nuclei (energids; lower panel). The upper panel shows the mitotic schedule (M: mitosis, red; otherwise: interphase, blue background), with those time points indicated for which we have data. See text for details.

