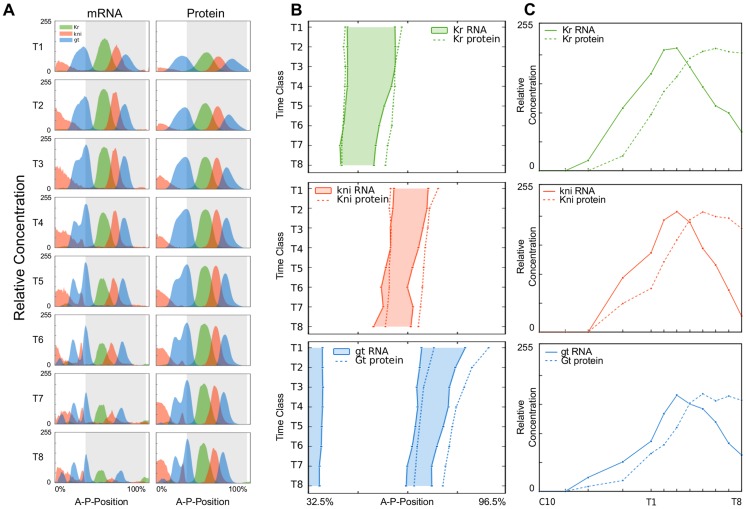
Figure 2. Comparison of gap gene mRNA and protein expression patterns.
(A) Time series showing integrated one-dimensional expression patterns of gap gene mRNA (left column) and protein (right column) along the A–P axis in cleavage cycle C14A (time classes T1–T8). Kr is shown in green, kni in red, and gt in blue. X-axes represent A–P position in %, where 0% corresponds to the anterior pole of the embryo. Y-axes represent mRNA and protein concentrations in relative units. Grey background indicates the region displayed in (B). (B) Space-time plots indicating domain boundary positions of the central Kr domain (top), the abdominal kni domain (middle), and the anterior and posterior domains of gt (bottom). Solid patterns indicate mRNA patterns, dashed lines protein. Time flows downwards. (C) Temporal dynamics of peak expression for the central Kr domain (top), the abdominal kni domain (middle), and the posterior gt domain (bottom). Solid lines indicate mRNA, dashed lines protein. Relative concentrations (as in (A)) are plotted against time.

