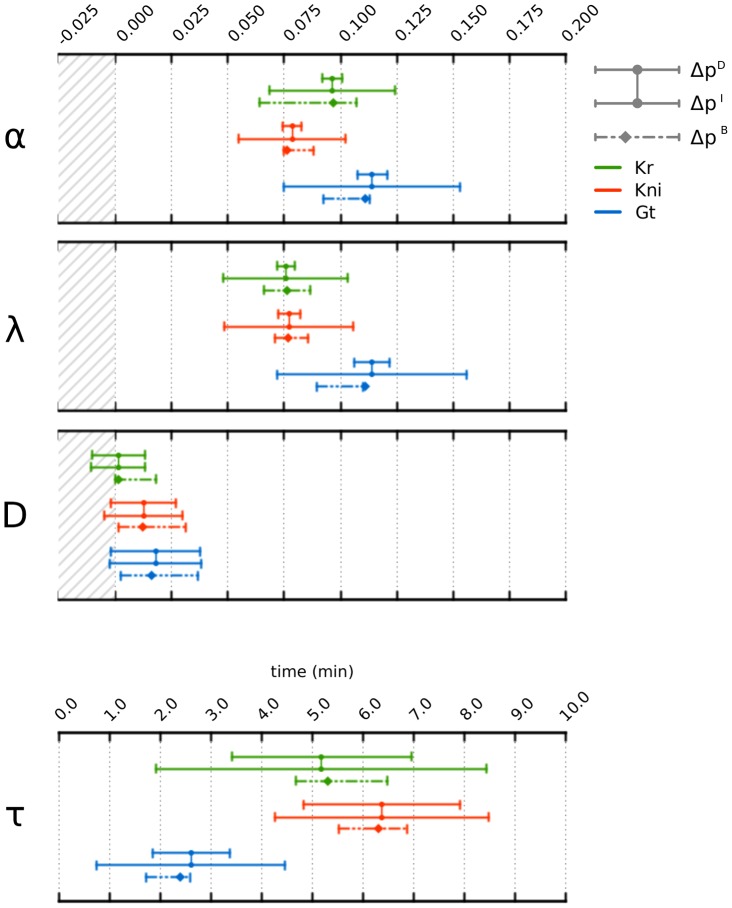
Figure 4. Confidence intervals for parameter estimates.
This figure shows 95% confidence intervals for parameters  (production rate),
  (decay rate),
  (diffusion rate), and
  (production delay; see equation 1) for Kr (green), kni (red), and gt (blue).
  are independent,
  dependent intervals obtained from linear analysis (connected solid lines),
  are intervals obtained from bootstrapping (dashed lines). Dots (on solid lines) represent eSS parameter estimates, diamonds (on dashed lines) those from SA. Striped grey background indicates parameter values that lie outside the search space limits used for optimisation. Note that only a subregion of the search space is shown in each panel (see Materials and Methods for values of search space limits).

