
Figure 3.
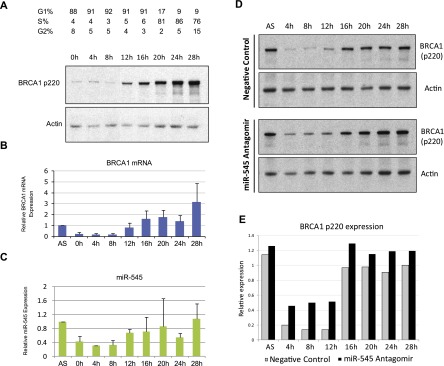
miR-545 modulates the endogenous expression of BRCA1 during the cell cycle. (A) T98G cells were synchronized in G0/G1 by serum starvation for 72 h. Upon release from the block by serum addition, the expression of BRCA1 p220 was examined at 4-h intervals by Western blot. (B) qRT–PCR analysis of BRCA1 mRNA expression at the same 4-h intervals in synchronously growing T98G cells. Relative expression was normalized to that of GAPDH mRNA and to BRCA1 mRNA levels in asynchronously growing (AS) T98G cells. Data represent the average of four independent experiments. Error bars indicate the SD. (C) qRT–PCR analysis of miR-545 in the same cells revealed a similar expression pattern, with relatively low, but not absent, expression in early and mid-G1 (0–8 h) and elevated levels in late G1 (12–16 h) and S/G2 (20–28 h). miR-545 expression was normalized to RNU6B expression and miR-545 level in asynchronous (AS) T98G cells. Data represent the average of four independent experiments. Error bars indicate the SD. (D) Western blots showing the expression of BRCA1 p220 during the cell cycle progression of synchronously proliferating T98G cells treated with either a control reagent (top panel) or miR-545 antagomir (α-miR-545) (bottom panel). (E) Quantitation of BRCA1 p220 expression by densitometry in the synchronously proliferating, miR-545 antagomir- or control-treated T98G cells shown in D. Actin served as a loading control in A and D.