
Table 5.
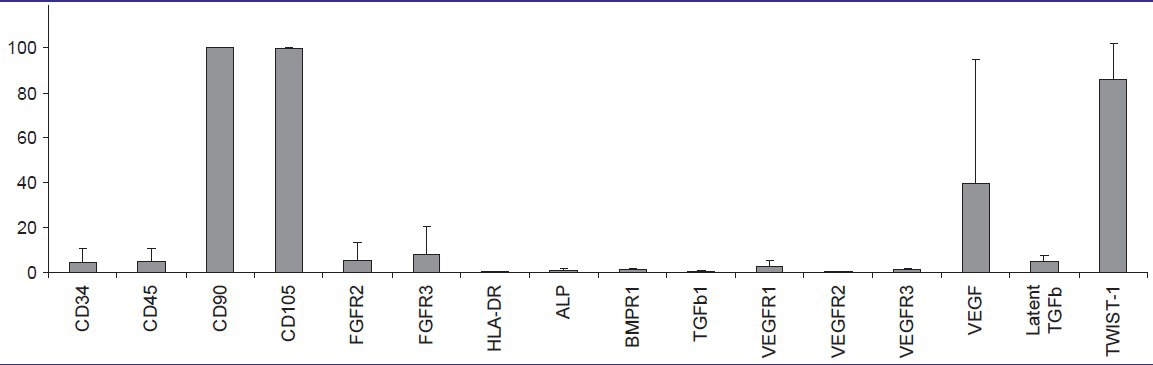
Column diagram from flow cytometry data of osteoblasts. Columns illustrate mean surface marker expression levels with standard deviation error bars of all three patient samples
Official websites use .gov
A
.gov website belongs to an official
government organization in the United States.
Secure .gov websites use HTTPS
A lock (
) or https:// means you've safely
connected to the .gov website. Share sensitive
information only on official, secure websites.
Column diagram from flow cytometry data of osteoblasts. Columns illustrate mean surface marker expression levels with standard deviation error bars of all three patient samples