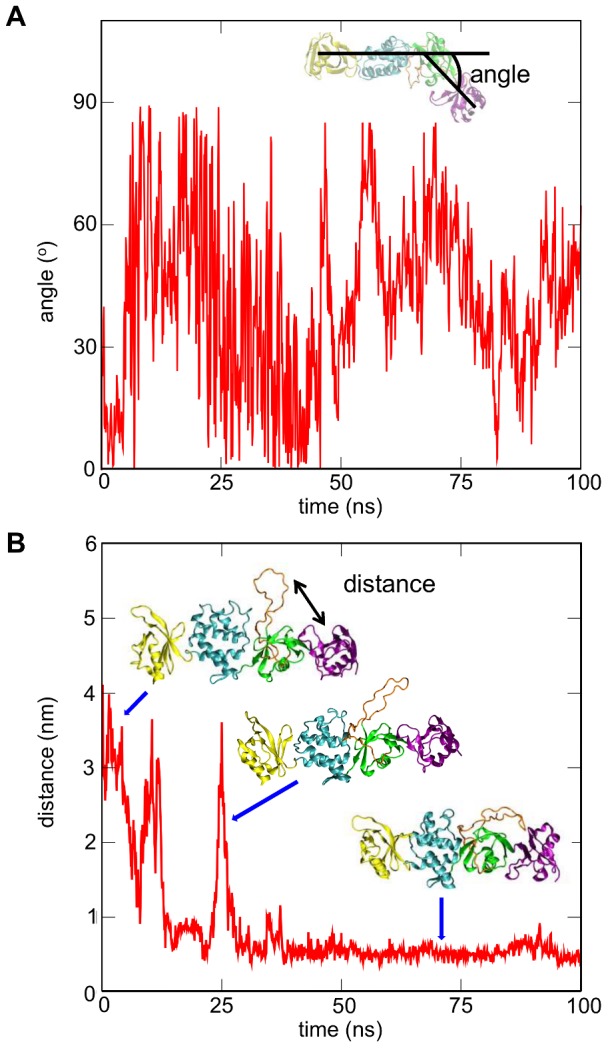
Figure 3. Simulation of talin in water (tal-sol-AT; see Table 1 ).

A. Change in the angle of the F0–F1 pair relative to the F2–F3 pair from its initial position (i.e. the crystal structure) during a simulation in aqueous solution. The definition of the angle is shown in the inset. For this calculation two vectors were used: vector one was defined from the center of mass of the backbone particles of the F3 subdomain to the center of mass of the backbone particles of the F2 242–248/283–295 residue region. Similarly, vector two was defined from the center of mass of the backbone particles of the F0 subdomain to the center of mass of the backbone particles of F2 (residues 242–248/283–295). The angle displayed is the difference between the angle formed by these two vectors in the crystal structure and the angle formed by the two vectors in each snapshot of the simulation. B. Distance between the F1 loop (residue: L145) and the talin F0 domain (residue: G11) during the same simulation. The position of the loop is shown in the inset pictures at different time points.
